

International Conference
“
Science of the 21st century: society and digitalization
”
Conference Proceedings. Scope Academic House, January 30, 2021, Sheffield, UK.
137
PROBABILISTIC AND MATHEMATICAL FEATURES OF RANDOM ERROR IN
ANALYTICAL MEASUREMENT METHODS
Rashidov A.S.
1
Kholboev B.M.
2
1
Rashidov Azamat Sattorovich, researcher, Department of
Automation and control of
technological processes,
Karshi engineering-economics institute (Uzbekistan)
2
Kholboev Bokhodir Murodovich., associate professor, Plekhanov Russian University
of Economics, Tashkent Branch (Uzbekistan)
This article discusses the essence of random errors, the results of which are subordinate
and determined on the basis of the law of normal distribution. At the same time, the
main points of calculating the mathematical expressions of the distribution law of a
random variable are studied.
It is also indicated that
с
considering distribution function, it is possible to evaluate any
characteristic of a random variable and the possible intervals of its value, and the
advantage of this method since the calculation results are 95% of the probability of the
outcome.
Key words: procedures of measurements (PM), error, result, interval, standard
deviation, assimetriya, value.
Introduction: Scientists of our time, developing new innovative ideas, strive to
achieve high results with minimal losses are generated due to random errors.
Minimization of these errors is possible with strict and careful control of probabilistic
and mathematical calculations. The advantage and demand for these calculations can be
seen If they give the most accurate calculation results with a probability of up to 95%.
And also these calculations are easy to perform and the use of complex integral calculus
is not required to generalize the results of measurement errors. The developed
analytical methods for performing measurement procedure (MP), which are
subsequently introduced into the technological processes of the food industry, should
strive to be developed in such a way that the random part, which is prevailing in the
resulting error. It will allow increasing the accuracy of the measurement result only by
performing a certain number of repeated measurements, without spending time and
money on improving the MP or replacing it with a more accurate one [1-8].
Main part: The contribution of random error to the total uncertainty of the
measurement result can be estimated using the methods of probability theory and
mathematical statistics. Due to the presence of a random error, the same value of
X
acquires a new, unpredictable value with each subsequent measurement. Such values
are called random. Random variables are not only the individual results of
measurements
x
i
, but also the mean
x
(as well as the variances
𝑆
2
(𝑥) = 𝐷
and all the
quantities derived from them). Therefore,
x
can only serve as an approximate estimate
of the measurement result. At the same time, using the values of
x
and
S
2
(x)
, it is possible
to estimate the range of values in which the result can be located with a given
probability. This probability is called the confidence level, and the corresponding
interval of values is called the confidence interval.

International Conference
“
Science of the 21st century: society and digitalization
”
Conference Proceedings. Scope Academic House, January 30, 2021, Sheffield, UK.
138
A rigorous calculation of the boundaries of the confidence interval of a random
variable is possible only on the assumption, this quantity obeys some well-known
distribution law. The distribution law of a random variable is one of the fundamental
concepts of probability theory. It characterizes the relative proportion (frequency,
probability) of the appearance of certain values of a random variable during its repeated
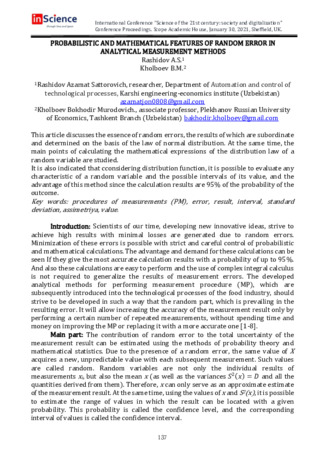
reproduction. The mathematical expression for the distribution law of a random
variable is its distribution function (probability density function)
p (x).
Shown in
Fig.1
as an example, bell-shaped and in
Fig.2
a symmetric graph of the
normal (or Gaussian) distribution function is the most typical for the results of chemical
analysis and analytical MP.
µ
х1
х2
µ-3σ µ-2σ µ-σ
µ+3σ
µ+2σ
µ+σ
p(x)
x
0
ẋ
˂
˂
Figure: 1 Bell-shaped normal distribution
function
Figure: 2 Symmetric graphs of the normal
distribution function
𝑓(𝑥) =
1
𝜎√2𝜋
𝑒
−
(𝑥−𝜇)2
2𝜎2
(1)
In formula (1), the parameter
μ
of this function characterizes the position of the
maximum of the curve, i.e. is the actual value of the analysis result, and the parameter
σ
is the width of the "bell", i.e. reproducibility of results. It can be shown that the mean
x
is an approximate value of
μ
,
and the estimate of the standard deviation
S(x)
is an
approximate value of
σ
. Naturally, these approximations are more accurate, larger than
the experimental data which they are calculated, i.e. greater than the number of parallel
measurements
n
and, accordingly, the number of degrees of freedom
f
[2].
Assuming the subordination of the random variable
X
to the normal distribution
law, its confidence interval is calculated by the formula:
∆x ± t
(P,f)
S(x)
,
(2)
The width of the confidence interval of a normally distributed random variable is
proportional to its standard deviation. The numerical values of the proportionality
coefficients
t
were first calculated by the English mathematician U. Gosset, who signed
his works with the pseudonym Student, and called Student's coefficients. They are
tabulated depending on the values of the confidence probability and the number of
degrees of freedom
f
, corresponding to the standard deviation estimate of the standard
deviation
S(x):
the higher the confidence probability, the wider the confidence interval
should be in order to guarantee that the value of
x
falls into. The dependence of
t
on
f
is
explained as follows. Since
S(x
) is a random quantity, due to random reasons, its value
may be underestimated. In this case, the confidence interval will turn out to be
narrower, and the entry of the value of
x
can no longer be guaranteed with a given
confidence probability. To "insure" against such troubles, the confidence interval should

International Conference
“
Science of the 21st century: society and digitalization
”
Conference Proceedings. Scope Academic House, January 30, 2021, Sheffield, UK.
139
be expanded by increasing the value of
t
, and the value of
S
is known, i.e. the smaller the
number of its degrees of freedom [1].
If the unit value
x
has a normal distribution, then the mean
x
с
also has a normal
distribution, in this case:
∆x
c
± t
(P,f)
S(x
c
)
S
(
x
с
) is less than
S(x):
𝑆(𝑥
𝑐
) = 𝑆(𝑥)/𝑛
.
(3)
To calculate the confidence interval, a question about the choice of the confidence
probability
P
can be given. If
P
values are too small, the conclusions become
insufficiently reliable. In this case the confidence intervals turn out to be too wide, poor
informative. Too large (close to 1) values are also impractical for the most chemical
analytical tasks; the optimal
P
value is 0.95.
The most complete information about the accuracy of the measurement result
contains the real distribution function, displayed in the form of a table, graph or
analytical formula. Knowing the distribution function, it is possible to estimate any
characteristic of a random variable and possible intervals of its value. However, the
determination of the distribution function is fraught with great difficulties, with the
formulation of special experiments in a number of cases and the solution of complex
probabilistic problems. Therefore, it is advisable to determine the real distribution
functions only with particularly accurate and critical measurements, as well as in cases,
according to the conditions of the problem, it is necessary to compare (compare) the
values of the measured quantities slightly differing from each other [2-4].
In this regard, the typical approximations of the probability density given in Table
1, it is advisable to use characterizing the accuracy indicator in cases of a priori
information or theoretical premises, it is possible to justify the form of the distribution
law. This significantly reduces the volume of statistical research.
Tabl. 1. Standard approximations of the error probability density
Function
Asymmetry
Excess
Normal
0,0
0,0
Triangular (Simpson’s)
0,0
2,4
Trapezoidal
0,0
2,2
Equal 1
0,0
1,8
Antimodal 1
0,0
1,4
Relay
0,6
3,3
Special characteristics skewness and excess are used to quantify the deviation of
the actual distribution function from the normal one. Asymmetry is determined by the
formula:
𝜌 =
∑ n
j
(x−x̅)
3
ns
3
(4)
Here
n
j
is the number of measurements in the
j
—
group;
n
is the total number of
all measured values;
s
- estimate of the standard deviation.
Asymmetry is a dimensionless quantity for any symmetric distribution
ρ
= 0
. For
ρ
> 0
, left-sided asymmetry occurs, for
ρ
<0
, right-sided. If they have small values for the
studied distribution, then we can assume that this distribution is close to normal. On the

International Conference
“
Science of the 21st century: society and digitalization
”
Conference Proceedings. Scope Academic House, January 30, 2021, Sheffield, UK.
140
contrary, large values of these characteristics indicate significant deviations of the
studied distribution from the normal one. The excess is determined by the formula:
𝜀 =
∑ 𝑛
𝑗
(x
i
−x̅)
4
𝑛𝑠
4
(5)
Excess is also a dimensionless quantity that characterizes the degree of sharpness
(or diffuseness) of the distribution curve: for a pointed distribution
ε
> 0
and for a flat
ε
<0.
In the absence of data on the form of the distribution function of the components,
the errors of the measurement results are presented in the form of: performed estimates
of the standard deviation of the measurement result, estimates of the systematic
component and the number of measurements. The values of the systematic and random
components of the error can be expressed in absolute and relative forms in any case.
Interval estimates of the total error or separately systematic and random
components are the most preferable methods of the listed. In all cases, the error should
be called the appropriate term to avoid ambiguity of understanding.
Example:
The linear velocity of the div is
121 m / s
, the confidence interval of
the total error is from
1 to 2 m / s
at a confidence level of
0.95
, or the confidence interval
of the random error of a single measurement is
± 0.5 m / s at P = 95%,
or arithmetic
mean of the linear velocity of the div
101 m / s;
the confidence interval of the
systematic error is
(1
–
2) m / s
at
n = 15
and
P = 95%.
The following error characteristics can be used to express the specified norms for
the accuracy of the measurement results, the assigned (actual) values of the accuracy of the
test results, as well as the statistical estimates of these indicators.
1. The lower and upper boundaries of the interval in which the error of the
measurement results is found with a given probability
P:
in absolute
± Δ
p
or relative
± δ
Р
(%)
form.
2. The standard deviation of the total error of the measurement results
σ
(
Δ
)
or
σ
(
δ
).
3. The lower and upper boundaries of the interval with a given probability
P
, there
is not excluded systematic component of the error
± Δ
s
and the standard deviation of the
random component of the error of test results
σ
(
Δ
).
4. Test results are Standard (limit) of repeatability (convergence)
r
and standard
(limit) of reproducibility
R
.
4.1. The standard (limit) of repeatability (convergence) of test results
r
is the
maximum permissible absolute discrepancy for a confidence level of 0.95 between two test
results obtained under repeatability (convergence) conditions (a characteristic that is part
of the random component of the error of measurement results, which is usually specified
in the documents on measurement methods and allows for on-line control of the accuracy
of test results)
r ≥ |x
1
− x
2
|
,
where x
1
and x
2
are two measurement results of the same
object using the same technique in the same laboratory by the same operator using the
same piece of equipment for a short period of time.
4.2. The standard (limit) of reproducibility R is the maximum permissible
discrepancy for a confidence level of 0.95 between two measurement results obtained
under reproducibility conditions:
R ≥ |x
1
− x
2
|
| where
x
1
and
x
2
are, respectively, the
results of repeated measurements of the same object using unified methods in
accordance with the requirements of the same regulatory document using different
pieces of equipment by different operators at different times.

International Conference
“
Science of the 21st century: society and digitalization
”
Conference Proceedings. Scope Academic House, January 30, 2021, Sheffield, UK.
141
In accordance with the requirements of the same regulatory document in
different laboratories, x
1
and x
2
- the results of measurements of the same object using
uniform methods are carried out inter laboratory measurements for the purpose of
confirming compliance.
The statistical estimate of the error of the measurement results reflects the
degree of closeness of a separate, already obtained test result to the actual value of the
measured quantity.
5. The statistical estimate of the non-excluded systematic component of the
measurement results error is represented by the standard deviation of the non-
excluded systematic component of the measurement results error
σ
(
Δ
s
).
If the mathematical expectation of the systematic component of the error of the
measurement results is known and constant, then the corresponding correction is
introduced into the measurement results.
6. Statistical assessment of repeatability (convergence) is represented by the
standard deviation of repeatability (convergence) of measurement results - an indicator
of convergence:
𝜎 → 𝑠√
∑
(x
i
−x̅)
2
𝑛
𝑖=1
𝑛−1
(6)
Here
x
i
—
i-th
(i=1,…n, n≥30)
- measurement result obtained under repeatability
(convergence) conditions;
x
- Is the arithmetic mean of n test results under
repeatability (convergence) conditions. Assuming a normal distribution of the random
component of the error at n=2
и
Р
=0,95:
σ = 0,36𝑟Ошибка
!
Закладка
не
определена
..
For n≥20, we can consider: σ(∆) ≅ 2σ
r
For cases where the systematic
component of the error can be neglected, the lower and upper boundaries of the interval
in which the error of the measurement results is located: for the absolute one -
∆=
±2σ(∆)
7. The statistical assessment of the reproducibility of the measurement results is
represented by the standard deviation of the reproducibility of the measurement results
σ
R
,
σ
r
= 0.36r (for n = 2
and
P = 0.95).
The algorithm for calculating random errors
should be developed so that one observation can be accepted; moreover, the random
component of the error should, as a rule, be expressed through an estimate of the
standard deviation of a single measurement [9,11].
The value of the confidence level should be taken (but not determined
experimentally) equal to 0.95. Other levels of significance should be justified. At the
same time, the predominance of a random error as a component in the result allows, if
necessary, to increase the accuracy of the measurement result only by performing a
certain number of repeated measurements, without spending time and money on
improving the MP itself or replacing it with a more accurate one[1,4,5,10,11].
Conclusion: It is impossible to predict the observation result or correct it by
introducing a correction. It can only be asserted with a certain degree of confidence that
the true value of the measured quantity is within the scatter of the observation results
from
x
min
to
x
max
, where
x
min
,
x
max
are the scatter boundaries, respectively.
However, it remains unclear what is the probability of the appearance of this or
that error value, the set of values lying in this range of values to take as a measurement
result, and what indicators to characterize the random error of the result. To answer
these questions requires a fundamentally different approach than the analysis of

International Conference
“
Science of the 21st century: society and digitalization
”
Conference Proceedings. Scope Academic House, January 30, 2021, Sheffield, UK.
142
systematic errors. It is based on the consideration of observation results, measurement
results and random errors as random variables. Methods of the theory of probability
and mathematical statistics make it possible to establish probabilistic (statistical)
patterns of occurrence of random errors and, on the basis of these patterns, give
quantitative estimates of the measurement result and its random error. To characterize
the properties of a random variable in probability theory, the concept of a probability
distribution law is used for a random variable. The distribution function is the most
versatile way to describe the behavior of measurement results and random errors.
However, it is necessary to carry out very lengthy and painstaking research and
calculations to determine them.
References
1. Begunov A.A , Akhmedov B.M, Rashidov A.S Main aspects and topical issues of
analytical measurements in technological industries: Monograph // ed. prof. A.A.
Begunov
–
Karshi
Е
EI. "Nasaf", -2018.
2. Kravchenko N.S, Revinskaya O.G Methods of processing measurement results
and estimation of errors in an educational laboratory practice. Tutorial. National
Research Tomsk Polytechnic University. - Tomsk: Publishing house - 2011. - 88p.
3. Begunov A.A. Metrology. Analytical measurements in the food and processing
industry: textbook for universities / A.A. Begunov.-SPb: GIORD, 2014.-440 p.
4. Akhmedov B.M Scientific foundations and methodology for the uniformity of
measurements in food quality management. - Dissertation for the degree of Doctor of
Technical Sciences - T., 2009.
5. Rakhmatov X.B, Safarov M.J, Mallaev A.R Metrology in modern analytical
chemistry. Monograph, - Karshi, "Nasaf", -96. -2019.
6. Begunov A.A, Fedorova P.M. Methodological recommendations for statistical
processing of measurement experiment data. - L.: NPO "Maslozhirprom", 1989.- 62 p.
7. Begunov A.A, Akhmedov B.M, Ibragimov R.A, Rashidov A.S Measured property
of objects in analytical measurements/ Chemical technology control and management
International scientific and technical journal 4-5/2018/ page.38-41.
8. Rashidov A.S “Features of the Method for Performance of Measurements of
Mass Fract
ion of Water in Food by Thermogravimetric Method” International journal of
advanced research in science, engineering and technology. Of IJARSET, Volume 7, Issue
10, October 2020.
9. Begunov A.A, Akhmedov B.M, Rashidov A.S Current issues and main aspects of
unification analytical measurement methods (on the example of moisture
measurement)/ Acta of Turin Polytechnic university in Tashkent/ Edition 3/2019 page.
32-36.
10. Rashidov A.S Emerging errors on moisture meters/ Integration of world
scientific processes as the basis of social progress. Materials of International scientific
and practical conferences of the Society of Science and Creativity/ Kazan/Edition
№38/2016 page 190
-194.
11. Begunov A.A, Rashidov A.S Testing and analysis errors/ Innovative
technologies on ensuring the quality and safety of chemical and food products. II-
Republican Scientific and Technical Conference. 17
th
of May, 2019/ page 202-204


