


Economics and Innovative Technologies. Vol. 2019, No. 5, september-october
12
5/2019
(№
00043)
Intellectual property objects:
theory and аnalysis
Rizaev Nurbek Kadirovich
1
Ibragimov Abdugafur Karimovich
2
1
Doctor of Economics Professor of
“Аccounting , analysis and audit”
department
1
Doctor
of Economics Professor of “Аccounting, analysis and audit”
department
Banking and finance academy of the republic of uzbekistan
E-mail:
Abstract:
This article is devoted to the consideration of issues related to the formation of
the world intellectual property as well as costs spent on creation of research and experimental
developments. In addition, the article analyzes the issues of assessment and organization of
innovative products. In the context of global globalization, intellectual property objects are crucial
in assessing the property of enterprises. However, the methodology of analysis of intangible assets
has not been comprehensively presented in scientific works. therefore, this article developed a
methodology for the analysis of intangible assets, in particular the analysis of intellectual property.
Key words:
ecosystem, artificial intelligence, additive technology, intellectual property,
research and experimental-development activities, patent, industrial sample, useful model,
invention, intellectual property fixed assets analysis accounting balance methodology following
indicators the correlation dependencies raise.
Introduction
As far as we know, currently the volume of the market of intellectual property
objects and innovation products is rapidly increasing throughout the world. In particular,
the market of
“
artificial intelligence”- (AI) rose from
31 percent and in 2017 this indicator
accounted for 3 billion USD, and in 2018 this figure constituted 8,1 USD and this year it has
amounted to 13,4 billion UZS. Moreover, it is expected, that by 2022 this indicator will
total 52,5 billion UZS (Frost & Sullivan
2019). This, in turn, requires creation of the
intellectual property ecosystem and its further development. Moreover, development of
the intellectual property market will be mainly connected with the creation of this
ecosystem. It should be noted, that the concept of “Intellectual property ecosystem”
appeared in foreign countries many years ago and currently it approached the level of
development. For example, in the USA the intellectual property ecosystem is referred to
the Silicon Valley which unites major venture companies, investors, tart-ups and
entrepreneurs. The reason for this that head offices and lab rooms of the famous world-
wide known companies and giants of the electronic industry (Apple, Google, Facebook,
Intel, AMD, Electronic Arts) are located there. They are involved in the development of
intellectual projects and this fact results in the creation and further development of
intellectual property ecosystem, which, in turn, leads to ensuring innovative globalization.
Literature review
In terms of the world globalization, the data on the intellectual property objects is
crucially important when assessing the property of enterprises because currently

Economics and Innovative Technologies. Vol. 2019, No. 5, september-october
13
5/2019
(№
00043)
innovative development is considered to be one of the top priorities for companies to raise
the volume and value of intellectual property objects. This, in turn, requires a particular
attention to be paid not only to accounting but also to economic analysis.
It should be noted that the system of indicators which represent the state and
conditions of intellectual property objects hasn’t been created by scientists and experts
who have developed scientific papers in the field of economic analysis. In particular, I.
Abdukarimov considers intellectual property objects as a component of intangible assets
as a major source for the analysis of the accounting balance sheet analysis. However, the
methodology for the analysis of intangible assets has not been comprehensively presented
in scientific works (the author provides a comprehensive analysis of the status and use of
fixed assets in his research).
The first approach to the analysis of intellectual property objects in our country has
been made by M. Pardaev [1] who has demonstrated these objects as a component of
intangible assets in the following indicators:
- indicators that reflect the state of intangible assets;
- indicators that reflect the efficiency of intangible assets.
Indicators of intangible assets include their total volume, average annual cost, their
share in total assets, and depreciation ratio of intangible assets.
In addition, A. Vakhobov and A. Ibrokhimov studied the issues on only fixed assets
and methodological aspects of analysis of their use [2].
In the opinion of M. Bakanov and A. Sheremet, balance indicators, including
intangible assets, constitute the source for economic analysis. However, there is lack of
precise information on the methodology for the analysis of production inventories and
there is almost no data on intangible assets (intellectual property objects) [3].
O. Tolpegina and N. Tolpegina focus on the analysis of long-term assets, including
comprehensive analysis of depreciable property. Herewith in terms of the analysis
scientists have evaluated only fixed assets among the depreciable property [4] .
According to the view of M.Abryutina, intangible assets have become one of the
most significant indicators of the balance sheet and play a particular role as the analysis
technique. This scientist has not developed any methodology for analyzing precisely
intellectual property objects [5].
N. Kazakova in her research focuses on the issues of diagnosing the state and
development of business, where she considers intangible assets as one of the key
indicators in the analysis of the balance sheet [6].
The Russian scientist T. Grigoryeva in her scientific paper considers the status of
intangible asset analysis is part of the company’s property performance indicators. In
addition, in the process of the analysis of the company’s liquidity ratios she attributes
intangible assets into a group of the assets which are difficult to sell. At the same time, the
research of this scientist does not fully regulate the order of analysis of intellectual
property objects [7].
According to N. Voytolovsky, the analysis of intangible assets is included in the
financial analysis and taken into consideration in the analysis of the property structure.
Moreover, it is stated by the scientist that it should be used as a source of analysis in
calculating profitability indicators, though he has not specifically mentioned intellectual
property objects [8].

Economics and Innovative Technologies. Vol. 2019, No. 5, september-october
14
5/2019
(№
00043)
From the point of view of S. Dybal, the methodology for the assessment of the
enterprise’s property focuses on the horizontal and vertical analysis of intangible assets,
paying a particular attention to their structure and composition. Intangible assets, in the
form of patents and licenses resulting from innovative activities, indicate that they have a
very small share in the overall property of the enterprise [9].
In addition, V.Bocharov has studied the structure and dynamics of intangible assets
by means of horizontal and vertical analysis of their current state [10].
Furthermore, Russian scientists O. Yefimova and L. Dontsova have conducted the
research on the analysis of intangible assets as well. For example, O.Yefimova provides
information on the methodology for the analysis of intangible assets, as well as the
primary objectives of the analysis: the composition and structure of intangible assets,
estimation of sources of funding and their efficient use. Nevertheless, the scientist
provides insights into the methodology for analyzing the composition and structure of
intangible assets (however, she hasn’t developed the efficiency indicators system) [11].
It is obvious, the scientific paper of this economist can be considered as one of the
first works on the analysis and assessment of intangible assets as a separate object of
analysis.
Moreover, L.Dontsova focuses on the analysis of intangible assets in the field of
analysis of depreciable assets. The analysis of intangible assets requires revealing of their
volume, structure and dynamics. It is the first time when the scientist considers the
analysis of the structure and composition of intellectual property objects [12].
Analysis and results
In the world practice, the concept of intellectual property ecosystem includes
owners of intellectual ideas, creators of intellectual property objects and series of
manufacturers of innovation products. This concept can be expanded by the following
statements:
first stage: creators of intellectual ideas or projects (institutes, universities). Projects
and developments on the certain intellectual property object, as well as new formulas are
created at this stage;
second stage: sample and form of intellectual property objects are created at this
stage. For example, industrial samples (on spare parts of motor vehicles);
third stage: the sample of the intellectual property object undergoes through
experimental testing (industrial samples, useful models and inventions). Then this
processed is followed by the commercialization of this product. In particular, herein the
industrial production of this sample starts. For example, the industrial sample on the spare
part of the motor vehicle is purchased by the manufacturer.
The intellectual property ecosystem can also be called an innovative ecosystem. The
innovation ecosystem is the complex of human, financial and other resources in the
process of the commercialization of innovations and their interrelations aimed at
interacting with the process of commercializing innovations and their enhancing
commercializing and optimizing innovations. From these stages it is obvious that the
intellectual property ecosystem will provide an opportunity for innovative development of
the industry in whatever area it is selected. That, in turn, leads to an increase in the
volume of innovative products in the economy. This requires an increase in the cost of
innovation in any country.

Economics and Innovative Technologies. Vol. 2019, No. 5, september-october
15
5/2019
(№
00043)
In the nearest future (over 10-15 years) innovative globalization will lead to the
development of the technologies applied to the qualitative changes throughout the world.
In addition, nowadays the tendency of the formation and development of the “intellectual
property ecosystem” hasn’t been adequately developed yet. In this regard it is expected
that within next decade huge amounts of investments will be made in such sophisticated
technologies as Bio Robot Refrigerators, internet solar panels 5G (Project Skybender), 5D
storage devices (Superman memory crystal), oxygen particle injection, underwater
transport tunnels (Hyperloop), bioluminescence trees, folding TVs, biological lenses for
unusual viewing, spray clothing, DNA-originated portraits, unmanned vehicles, a city
under the dome (Mall of the World), carbon dioxide and solar-fueled artificial leaves,
plasma area to protect against accidents, floating cities (Lilypad), 3D printed copies,
bionic insects for human organ transplantation operations (BionicANT), search for a new
life in a human being that can live 1 000 years and another life in space (FAST), etc.
Creation of these technologies as new objects of intellectual property will
definitely require significant costs. Currently in the developed countries of the world a
particular attention is paid to research activities and experimental development. That is,
there is a significant increase in deductible spending on the GDP of these countries.
Table 1
The share of regions in terms of expenditures on research activities in relation to the
gdp
1
Regions of the world
Expenditures on R&D
in relation to the GDP,
%
Share in relation to
total number of
researchers, %
North America and Western Europe
2,4
39,7
East Asia and the Pacific
2,1
38,5
Central-Eastern Europe
1,0
10,6
Latin America and the Caribbean
0,7
3,7
The Arab countries
0,6
3,9
South - West Asia
0,5
1,9
Africa
0,4
1,1
Central Asia
0,2
0,6
In North America and Western Europe, the average amount of expenditures on
creating intellectual property constitutes 2,4 percent in relation to the GDP, thus totaling
99,7 percent of researchers around the globe. It is also a high indicator in the countries of
East Asia and the Pacific (2,1 percent) and covers 38,5 percent of researchers. However,
this situation cannot be considered as positive in the Central Asian region, as the share of
expenditure on R&D amounts to only 0,2 percent in relation to the GDP and the share of
developers of innovation products accounts for 0,6 percent. For example, the countries
with the highest spending on research and development in terms of the GDP around the
globe are South Korea (4,3 percent), Israel (4,2 percent), Japan (3,8 percent) and Sweden
(3,1 percent).
1
UNESCO Institute for Statistics (UIS).

Economics and Innovative Technologies. Vol. 2019, No. 5, september-october
16
5/2019
(№
00043)
Table 2
Data on the expenditures made on the r&d and experimental developments in
relation to the gdp of the world countries
2
Countries
Expenditures in relation to
the GDP
Number of researchers by
one million people (number
of people)
in percent
billion USD
South Korea
4,3
73,1
6856
Israel
4,2
9,9
8250
Japan
3,4
131,8
5328
Sweden
3,1
14,2
6877
Germany
2,9
109,5
4318
USA
2,7
476,4
4217
France
2,3
38,5
4233
Singapore
2,2
10,0
6729
China
2,0
370,6
1096
Great Britain
1,7
43,8
4254
Russia
1,1
40,3
3094
India
0,8
48,0
156
Kazakhstan
0,2
0,718
790
Uzbekistan
0,2
0,342
500
The amount of expenditures in relation to the GDP accounts for 476,4 billion USD in
the USA, 370,6 billion USD in China, 131,8 billion USD in Japan and 109,5 USD in Germany.
The most important thing is that up to this day the USA has mastered almost 6 USD or 38
percent of the GDP having produced intellectual property objects for this amount. It
should be noted that the number of people who create intellectual property objects and
are involved in research activities constitute 8250 people in Israel, 6856 in South Korea,
6877 in Sweden, 6729 in Singapore and 5323 in Japan.
This means that during recent years significant efforts have been made in Asian
countries to create innovative products. However, this situation cannot be considered
positive in the countries of Central Asia. In particular, in Kazakhstan the number of
researchers per one million constitutes 790 people, and in Uzbekistan this indicator
accounts for 500 people. In India this indicator constitutes 156 people per one million, but
the share of expenditures on research and development accounts for 0,8 percent (48,8
billion UZS) in relation to the GDP. Unfortunately, this indicator does not exceed 0,2
percent in the countries of Central Asia (Kazakhstan and Uzbekistan).
The analysis illustrates that the main part of expenditures in relation to the GDP
refers to the business sector. It is obvious that expenditures directed to business
development will be highly efficient. Among the analyzed countries we have the following
statistics in terms of creating intellectual property objects (innovation developments):
South Korea 78,0 percent (or 57,2 billion UZS), Japan 77,5 percent (131,8 billion UZS),
China 77,3 percent (286,5 billion UZS) and the USA 71,4 percent (340,7 billion USD).
2
UNESCO Institute for Statistics (UIS).

Economics and Innovative Technologies. Vol. 2019, No. 5, september-october
17
5/2019
(№
00043)
Table 3
Distribution of overall expenditures on innovation developments
3
Countries
billion USD
Business
sector
Public
administration
Education
system
Non-
commercial
sector
South Korea
57,2
8,2
6,6
1,1
Japan
131,8
14,1
21,3
2,2
USA
340,7
54,1
62,3
19,2
China
286,4
58,6
25,5
-
Russia
24,0
12,2
3,9
0,51
Great Britain
28,5
3,2
11,2
0,793
India
17,0
29,0
1,9
-
Germany
74,1
16,0
19,4
-
Sweden
9,5
0,531
4,1
0,34
France
38,5
7,7
13,4
0,915
Singapore
6,2
1.1
2,7
-
Israel
9,9
0,217
1,5
0,116
Kazakhstan
0,263
0,235
0,159
0,60
Uzbekistan
0,108
0,166
0,64
0,3
According to the data presented in Table 3 it is obvious that in terms of
expenditures directed to the education system (universities) which represent the first
stage of the intellectual property ecosystem, France is playing a leading role with 34,8
percent or 13,8 billion USD, then - Great Britain with 25,5 percent (11,2 billion USD) and
Germany with 17,7 percent (19,4 billion USD). However, in terms of creating the
innovation production to the public administration, the share of Russia accounts for 12,2
billion USD and the share of India amounts to 60,4 percent which equals to 29,0 billion
USD. In Uzbekistan the share of expenditures on the business sector amounts to 31,5
percent, on the public administration - 48,5 percent and on the education system - 18,7
percent, in Kazakhstan these indicators constitute 36,7 percent, 32,7 percent and 22,1
percent respectively. It should be noted, that from these figures it is obvious that the
country focuses on innovation and makes huge investments in innovation developments.
As a result, agencies and companies in these countries currently have a worldwide
reputation and their revenues are rapidly growing every day. This implies that the costs of
research and development activities will be very efficient and rewarding in future. The
welfare of such countries will be enriched not just by tangible assets, but by intangible
assets based on innovative ideas.
The following indicators constitute the most significant indices of economic
potential of intellectual property objects:
-
indicators that reflect the state of the intellectual property objects;
-
indicators that reflect the performance of the intellectual property objects;
-
indicators that reflect the efficiency of the intellectual property objects.
3
UNESCO Institute for Statistics (UIS).

Economics and Innovative Technologies. Vol. 2019, No. 5, september-october
18
5/2019
(№
00043)
This research represents an empirical analysis which has been performed to
determine the impact of intellectual property objects on the sale of goods. After all, each
business entity has the ultimate aim to enhance the amount of intellectual property
objects focusing more on selling, reducing the prime-cost of the goods manufactured and
improving its production efficiency, which will definitely lead to strengthening its market
position.
Intellectual property objects, long-term assets and current assets have been
accepted as factors affecting proceeds from the sale. The reason for performing an
empirical analysis by types of assets is that enterprise’s assets play a key role in the
production of assets. The descriptive statistics of the variables specified above are
presented in the table (Table 1):
Table 4
Descriptive statistics analysis for the intellectual property objects
4
Indicators
Proceeds from sales
of products
Intellectual property
objects
Long-term
assets
Current
assets
Medium
2312060501
14971664.64
1768873084
1029396462
Standard deviation
3477179347
31022214.4
3019015268
2050982284
Minimum
47098879
14000
6934845
1372562709
Maximum
10261781347
102822702
10222335009
6291970206
Number of objects
11
11
11
11
As the analysis of the descriptive statistics illustrates that the standard deviation of
proceeds from sales and long-term assets is quite bigger than of other variables due to the
fact that enterprises are operating in different areas. According to the minimum value, the
value of “AAA” enterprise which has the least number of intellectual property objects
among other business entities constitutes 14 million UZS. The value of “BBB” enterprise
which has the biggest number of intellectual property objects among other business
entities accounts for over 102 billion UZS. An important part of the empirical analysis of
the correlation of these variables is presented in the following table: as the correlation
matrix of variables (Table 2):
According to the correlation matrix, the correlation between the proceeds from
sales and the other variables demonstrates a positive correlation. It should be noted that
the correlation of proceeds from sales with intellectual property objects is much higher
than the correlation with other variables.
The correlation between types of assets is also positive and the correlation between
intellectual property objects and current assets is highly dependent. This implies a careful
approach to the outcome when inputting these two variables into the regression model
because such a high correlation of the independent variables can cause a multicollinearity
problem.
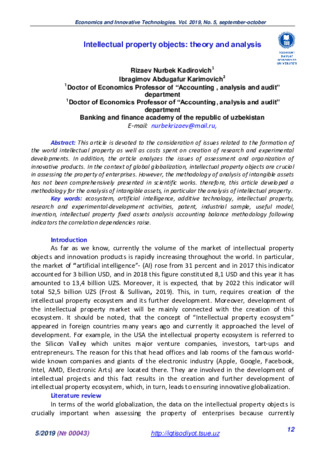
The correlation dependencies enable to provide a more comprehensive view of the
linear model. Therefore, below there are presented correlations of some variables of
natural logarithms. From the Figure given below it is obvious that there is a high positive
correlation between the proceeds from the sales of goods and other variables.
4

Economics and Innovative Technologies. Vol. 2019, No. 5, september-october
19
5/2019
(№
00043)
Table 5
Intercorrelation matrix of variables
5
Proceeds
from the
sale
Intellectual
property objects
(Intangible assets)
Long-term
assets
Current
assets
1. Proceeds from the sale
1.00
2. Intellectual property objects
0.68
1.00
3. Long-term assets
0.44
0.08
1.00
4. Current assets
0.57
0.83
0.42
1.00
Herein the empiric model can be represented in the following way:
j
i
i
i
i
VCT
NA
X
= a + b
+ g
+ e
where
𝑉𝐶𝑇
𝑖
–
i
- proceeds from the sales of goods,
𝑁𝐴
𝑖
–
i
– intellectual property
objects (intangible assets),
𝑋
𝑖
𝑗
– other assets included in the model,
𝜀
𝑖𝑗𝑡
– error.
Figure 1. Linear chart of variables
6
.
The main aim of conducting regression analysis of the intellectual property objects
is opportunity to calculate how the increase of the intellectual property objects by 1 UZS
will raise the proceeds from sales. The following Table demonstrates three models that
have been calculated by the least square method (Table 3).
Table 6
Regression model results
7
Мodel [1]
Мodel [2]
Мodel [3]
Intellectual property objects (Intangible
assets)
76.67**
(27.25)
73.02**
(24.67)
143.95**
(48.29)
Long-term assets
0.44 (0.25)
0.76** (0.30)
Current assets
-1.33 (0.80)
Constant
1164125369
(903486969)
433932776
(915439957)
171611221
(844394064)
R-square
0.47
0.62
0.72
5
Аuthor's development.
6
Аuthor's development.
7
Аuthor's development.
y = 0,6579x + 0,7348
R² = 0,1957
In
tellectu
al
p
ro
p
er
ty
o
b
jec
ts
Revenue
y = 1,222x - 5,1715
R² = 0,8932
No
n
-cu
rr
en
t
ass
ets
Revenueум

Economics and Innovative Technologies. Vol. 2019, No. 5, september-october
20
5/2019
(№
00043)
*** statistic significance of 1 per cent
** statistic significance of 5 per cent
* statistic significance of 10 per cent
According to the results of various models of regression analysis, positive impact of
intellectual property objects on the proceeds from sales has been confirmed on the basis
of the empirical analysis. The impact of intellectual property objects on the proceeds from
sales of goods in all peculiar properties of all models is considered positive and has high
social significance.
According to the models, it is possible to make a conclusion that an increase of
intellectual property objects (intangible asset) of any enterprise by 1000 UZS will result in
average increase of proceeds from sales by 98000 UZS.
Conclusions
By 2023 Uzbekistan has been assigned the task to reach and be included in the list
of 50 top countries by Global innovation index. To achieve this aim, the following measures
must be successfully implemented: ensuring intensity of scientific developments (R&D
Intensity), the degree of the Value Added Tax in production process (Manufacturing Value-
added), productivity, High-tech Density, Tertiary Efficiency, Researcher Concentration,
Patent Activity.
Efficient criteria for the intellectual property ecosystem in innovative globalization
are as follows:
first, a successful intellectual property ecosystem will focus on the
commercialization of innovative products;
second, a successful intellectual property ecosystem will ensure consistent, gradual
change of ideas;
third, a successful intellectual property ecosystem is a collaborative network of
professionals who provide continuity in the creation of innovative products.
In conclusion it should be noted that improvement of analyzing intellectual property
objects it will enable to:
-
assess changes by the structure of the intellectual property objects;
-
assess the state and flow of the intellectual property objects in terms of their
structure;
-
evaluate amendments in the ownership right and the right to dispose intellectual
property objects;
Moreover, the development of intellectual property ecosystems in our country
requires creation of relevant accounting system. This, in turn, necessitates strengthening
the regulatory framework for the elements that constitute this ecosystem. As a result this
will enable to recognize their accounting as new objects, to conduct their evaluation and
account as long-term assets.
Reference
1.
Pardaev M.K., Isroilov B.I. Financial analysis: Educational aid. -Т.: “Iqtisodiyot va
hukuk dynyosi”, 1999.-368 p.
2.
Vakhobov A.V., Ibrokhimov А.Т. Financial analysis. –Т.: “Sharq”, 2002.-224 p.

Economics and Innovative Technologies. Vol. 2019, No. 5, september-october
21
5/2019
(№
00043)
3.
Bakanov M.I., Sheremet А.D. Theory of the economic analysis: Textbook. 3-d
edition. М.: Finance and Statistics, 1996. -288 p.
4.
Tolpegina O, Tolpegina N. Comprehensive economic analysis of business activity.
In 2 volumes, V.1.
5.
Abryutina M.S., Grachev A.V. Analysis of the financial and economic activities of
the enterprise: Educational aid. – М.: «Delo i Servis». 1998.-256 p.
6.
Kazakova N.A. Financial analysis. “Yurayt” Publishing house, 2015. 539 p.
7.
Grigoryeva T.I. Financial analysis for managers. Textbook. “Yurayt” Publishing
house, 2015. -486 p.
8.
Economic analysis: textbook/edited by N.V. Voytolovskiy et al. Textbook.
“Yurayt” Publishing house, 2016. -548 p.
9.
Dybal S.V. Financial Analysis: Theory and Practice: Educational aid.- SPt.:
«Busines-Press», 2005.-304 p.
10.
Bocharov V. Financial analysis/ Brief course. 2-d edit. - SPt: Piter, 2009. – 240 p.
11.
Financial reporting analysis: Educational aid/О.V. Yefimova (иet al.) –М.:
«Omega-L», 2013.-388 p.
12.
Dontsova L.V. Financial reporting analysis. –М.: Publishing house М.: «Delo i
Servis», 2008.-368 p.
13.
Alexander Poltorak, Paul Lerner (2002). Essentials of intellectual property. John
Wiley &Sons. Inc. © 2002 New York.
14.
Аbdukarimov I.T. Ways to read and analyze financial reporting. Edited
publication. 3-d edition. Т.: “Iqtisodiyot va hukuk dynyosi”, 1999. -320 p.
15.
Leontiev B. B. The price of intelligence. Intellectual capital in Russian business. -
M.: Publishing Center “Aktsioner”, 2002 – 17-p.
16.
Textbook. - М.: “Yurayt” Publishing house, 2016.-363 p.
17.
(FIPS 2018) “Federal Institute of Industrial Property” of the Russian Federation.
http://www1.fips.ru/
18.
Civil Code of the Republic of Uzbekistan (Collection of legislative acts of the
Republic of Uzbekistan, 2017, №16, article 265).
19.
(2019)
http://www.tadviser.ru/
20.
Tadviser (2019). http://www.tadviser.ru/index.php.
21.
Worldwide-research (2019). https://www.statista.com/statistics/732247
22.
Worldbank (2019).
https://data.worldbank.org/indicator/gb.xpd.rsdv.gd.zs
23.
The Message of Shavkat Mirziyoyev, the President of the Republic of Uzbekistan
to the Oliy Majlis of the Republic of Uzbekistan. December 22, 2017.
24.
Resolution of the President of the Republic of Uzbekistan № 5544 “On
approving the innovation development strategy of the Republic of Uzbekistan in 2019-
2021”, September 21, 2018.
25.
Appendix 1 to the Resolution of the President of the Republic of Uzbekistan №
5544 “On approving the innovation development strategy of the Republic of Uzbekistan in
2019-2021”, September 21, 2018.
26.
UNESCO (2019). http://uis.unesco.org/sites/
27.
http://www.openinfo.uz/ru/reports/jsc/annual