


“Иқтисодиёт ва инновацион технологиялар” илмий электрон журнали. № 4, июль-августь, 2016 йил
1
www.iqtisodiyot.uz
S.A. Shelest, student,
I.D. Sokhibov, masters, TSUE
CURRENT STATE AND TRENDS OF CHANGES IN THE SECTORAL
STRUCTURE OF THE ECONOMY OF UZBEKISTAN
В данной статье произведена оценка современного состояния отраслевой
структуры экономики Узбекистана, рассматриваются структурные сдвиги и
качественные движения, происходящие в отраслевой структуре экономики
Узбекистана. Также проведен анализ факторов, вызывающих количественные и
качественные движения структуры экономики. Вместе с тем, в ней раскрыты
основные проблемы и существующие структурные диспропорции в отраслевой
структуре экономики Узбекистана.
This paper evaluated the current state of the branch structure of the economy of
Uzbekistan are considered structural changes and quality of movement taking place in
the sectoral structure of the economy of Uzbekistan. Also, an analysis of the factors
causing the quantitative and qualitative structure of the economy of motion. At the same
time, it covers the main issues and existing structural imbalances in the sectoral
structure of the economy of Uzbekistan.
Key words:
national economy, sectoral structure, sectoral proportions, structural
composition, modernization, technical and technological renewal of production, export
orientation, real sector, deterioration, GDP, industry, resource and raw material
industries, agriculture, services, traditional services, market services.
The formation of the national economy of Uzbekistan took place against the
background of the processes of transformation of state institutions, the implementation
of domestic and foreign policy of the country, as well as in close connection with the
general laws of the cyclic movements of the economy. Economic reforms 1990s of the
20
th
century that were of radically unsystematic nature and at the same time were carried
out with the errors of economic policy of Soviet times have led to a deep economic crisis
caused by significant imbalances that emerged in the sectoral structure of the economy,
the monopolization of economy, inefficiency of the administrative-command system of
economic management, a high degree of deterioration of the basic production funds of
the country, cuts in public investments, a deep crisis of the financial system, the rupture
of production-consumption relations of the finished products, a gap between the
development and implementation of radical economic and social reforms in the country.
However, the economic situation took a progressive tendency starting in the late
1990s. Due to an increase in exports, the acceleration of import substitution, a relative
reduction in production costs and other factors, there has been a positive trend in
industrial production and GDP, an improvement of financial condition of the real sector

“Иқтисодиёт ва инновацион технологиялар” илмий электрон журнали. № 4, июль-августь, 2016 йил
2
www.iqtisodiyot.uz
of the economy. However, the positive changes in process have not yet taken a
consistently irreversible and long-term character.
There has been a growth of GDP in recent years: whereas over 1996-2000 an
average annual growth rate amounted to 1.6%, throughout 2005-2015 it accounted for
8% annually. [12]
The sectoral structure of the economy of Uzbekistan is still characterized by the
presence of imbalances: a considerable role belongs to the resource and raw material
industries; the priority lies in fuel industry, while the infrastructural and agro-industrial
complexes are experiencing serious difficulties in their development; there is a high
concentration and monopolization of production. [3]
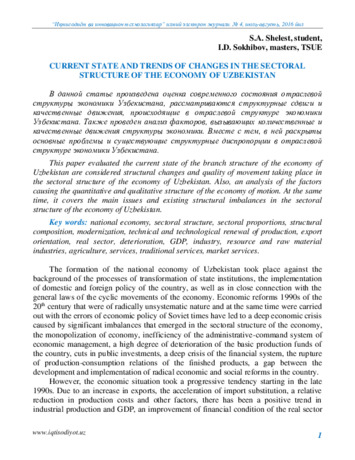
Uzbekistan is an agrarian-industrial country, the economy of which is dominated
by the services sector. Simultaneously, the role and proportion of industry in the
structure of the economy is increasingly growing, while the share of agriculture is
gradually declining. In particular, the share of industry in GDP has risen by about 10
percentage points over the past decade from 17.5% in 2004 to 24.1% in 2014. [12] The
industrial potential of the country has acquired a new development for the past 20 years
through the advancement of industries such as automobile manufacturing, agricultural
engineering, biotechnology, pharmaceutics and information technology. Agriculture, in
contrast, is characterized by a reduction of its share in GDP, making up 17.2% of GDP
in 2014 as against 26.4% in 2004. However, the predominant part of GDP falls on
services, whose share reached 54.5% in 2015 compared to 39.5% in 2006. [1]
Figure 1. Dynamics of changes in the sectoral structure of GDP of Uzbekistan in
the years 2004 - 2014.
Source: Compiled by the author based on the data of State Statistics Committee of
Uzbekistan.

“Иқтисодиёт ва инновацион технологиялар” илмий электрон журнали. № 4, июль-августь, 2016 йил
3
www.iqtisodiyot.uz
The sectoral structure of the industry is formed in such a way that the leading
position is held by engineering and metal-processing industry that has become the most
promising industry in the last 10 years as a result of structural changes in the economy
and industrial modernization. This fact is demonstrated by the fact that 19.7% of total
industrial production in 2014 accounted for machine building compared to 8.8% of
1995, which indicates a significant increase in the value of the industry in the economy.
The second most important sectors of the industry are fuel, light industry, food industry
and metallurgy, which are key sectors of industrial production of the country. In
particular, fuel industry is engaged in the production of natural gas, oil, coal that the
power energy runs on to fully meet domestic needs. Light industry is mainly specialized
in the cleaning of raw cotton, the production of yarn, thread, as well as wool, cotton,
natural silk fabrics and products from them. [12]
Overall, for the period of 1995-2014 the sector of industry has witnessed dramatic
changes and qualitative shifts in its composition due to the implementation of structural
reforms in the economy aimed primarily at modernization, technical and technological
renewal of production, as well as provision of export orientation of industries and
enhancement of the role of the real sector. Particularly, for the period under review there
was a growth of the proportion of such industries as construction materials, food
processing, chemical and petrochemical industries, forest, woodworking and pulp-and-
paper industry. Despite a relative fall in the proportion of metallurgy, light industry,
power industry in the overall structure of the industry, these industries are still dominant.
(Table 1)
Table 1
The share of production of basic industries in the total industrial output (as %)
Sectors
1995
2001
2012
2013
2014
1
2
3
4
5
6
Total industry
100
100
100
100
100
including:
power industry
7,5
9,1
7,9
7,5
7,1
fuel industry
10,8
15,0
18,3
15,8
13,1
non-ferrous industry
13,9
11,3
2,4
2,4
2,4
ferrous industry
10,0
9,5
8,8
chemical and petrochemical industry
5,2
5,5
5,3
5,4
5,5
mechanical engineering and metal working
8,8
9,2
17,0
19,8
19,7
forest, woodworking and pulp-and-paper industry 1,0
1,4
1,2
1,2
1,7
building material industry
4,5
5,3
5,4
6,4
6,1
light industry
18,6
19,5
12,9
13,0
14,0
food industry
9,8
14,1
14,0
13,2
16,0
others
19,9
9,6
5,6
5,9
5,7
Source: The figures of State Statistics Committee of Uzbekistan, "Industry of Uzbekistan".

“Иқтисодиёт ва инновацион технологиялар” илмий электрон журнали. № 4, июль-августь, 2016 йил
4
www.iqtisodiyot.uz
Industrial production, as evidenced by the figures, is growing rapidly: in 2014, it
rose by 8.3% compared to that of 2013. (Table 2) The most rapid growth rates are
witnessed in such branches as non-ferrous industry, mechanical engineering and metal
working, forest, woodworking and pulp-and-paper industry, building materials industry,
light industry, microbiological industry, glass and porcelain-and-faience industry.
Table 2
Dynamics of production of industries
Indicators
1997
2007
2012
2014
bln
soums
growt
h rate,
%
bln
soums
growt
h rate,
%
bln
soums
growth
rate, %
bln
soums
growt
h rate,
%
1
2
3
4
5
6
7
8
9
Total
607,8
104,1
18447,6
112,1 50730,6 107,7
75193,5
108,3
power industry
70,7
98,1
1738,9
101,8 4007,3
102,4
536805
102,2
fuel industry
99,7
104,3
3266,2
110,0 9294,8
106,2
9841,5
98,1
non-ferrous industry
7,2
83,5
450,8
111,9 1240,2
103,6
1800,5
116,5
ferrous industry
55,8
104,6
2895,1
101,4
5065,5
102,6
6580,1
101,7
chemical
and
petrochemical
industry
25,7
99,5
875,0
118,3 2670,8
106,4
4107,7
108,9
mechanical
engineering
and
metal working
46,4
102,2
2839,4
129,5 8627,9
112,4
14828,3
113,5
forest, woodworking
and
pulp-and-paper
industry
6,4
105,4
168,4
132,7 8627,9
112,4
1261,0
112,3
building
materials
industry
36,3
95,0
962,6
108,9 2719,2
111,0
4553,8
110,7
light industry
129,8
102,6
2532,8
107,6 6529,0
112,0
10555,5
116,1
including:
with cotton industry
n/a
n/a
n/a
n/a
3149,5
106,3
4114,5
107,0
without
cotton
industry
n/a
n/a
n/a
n/a
3379,5
117,7
6441,0
122,7
Feed industry
63,3
121
1715,7
117,6 7087,9
106,5
11993,9
107,6
Flour
milling
industry
n/a
n/a
n/a
n/a
1633,2
112,1
2100,5
108,1
Microbiological
industry
n/a
n/a
n/a
n/a
4,3
128,2
12,5
129,9
Glass and porcelain-
and-faience industry
n/a
n/a
n/a
n/a
212,4
100,0
439,8
119,7
Medical industry
n/a
n/a
n/a
n/a
358,3
120,7
564,5
112,6
Printing industry
n/a
n/a
n/a
n/a
431,1
103,0
745,0
109,5
others
66,5
112,6
1002,7
108,8 258,9
103,1
440,4
106,7
Source: The figures of of State Statistics Committee of Uzbekistan.
A positive factor in improving the structural composition of the industry in the
period of 2005-2014 was the rapid growth of manufacturing industries oriented to the

“Иқтисодиёт ва инновацион технологиялар” илмий электрон журнали. № 4, июль-августь, 2016 йил
5
www.iqtisodiyot.uz
production of finished products. Accelerated development of processing industries (an
average annual growth rate of 115.8%) was achieved, first of all, by the enterprises of
mechanical engineering and metal working (120.4%).
Within the timeframe of 2005-2014, an appreciable growth was seen in the
diversification rate of industry. The increase in the share of value added in industrial
output over the same period amounted to 15.7 percentage points, rising up from 30.6%
in 2005 to 46.3% in 2014. The growth of the diversification rate of industry was mainly
determined by an increase of this indicator in the power industry, the fuel industry,
ferrous and nonferrous metallurgy, machine building industry, building materials and
food industry. [2]
The promotion of the level of diversification of industry was advanced by the
expansion of the nomenclature of goods manufactured and the production of new
finished products in a number of industries. For example, for the period of 2005-2014
the share of new products in the total industry output increased: in light industry – from
0.02% to 3.0%; food – from 0.6% to 1.7%; chemical and petrochemical industries –
from 1.7% to 6.9%; in metallurgy – from 0.1% to 6.9%. Thanks to this, the proportion of
new products in the industrial output climbed from 4.5% in 2008 to 8.1% in 2014.
Outstripping growth rates in industries oriented to the production of goods with a
high degree of readiness (engineering and metalworking, food industry) have had a
positive impact on the change of sectoral proportions. As a result, the share of
processing industries in total industry increased from 38.5% in 2005 to 57.1% in 2014.
[2] (Figure 2)
Figure 2. Structural changes of fuel and raw materials and processing industries
Source: IFMR calculations based on the figures of State Statistics Committee of
Uzbekistan.
38,5
46,7
57,1
61,5
53,3
42,9
0%
10%
20%
30%
40%
50%
60%
70%
80%
90%
100%
2005
2010
2014
Fuel and raw-materials industries
Processing industries

“Иқтисодиёт ва инновацион технологиялар” илмий электрон журнали. № 4, июль-августь, 2016 йил
6
www.iqtisodiyot.uz
In the years 2005-2014 the tendency of gradual reduction of the share of agriculture
in GDP (from 26.3% in 2005 to 17.2% in 2014) was maintained owing to the further
expansion of the development of industries and services. In addition, a proportional
moderation of agriculture was accompanied by positive annual growth rates of
agricultural output that averaged at 6.3% and were sustained through structural
reformations and the execution of measures on the preservation of sustainable
development and modernization of agriculture. [14]
Over the years of independence, the sectoral structure of gross agricultural
production has changed: crop production was observed to grow in its portion to make up
59.0% in 2014 against 55.6% in 2007, while the share of livestock output, in contrast,
dropped to form 41.0% in 2014 compared to 44.4% of 2007. (Table 3)
Table 3
Dynamics of the major indicators of agriculture of the Republic of Uzbekistan
1997
2007
2012
2013
2014
bln
soums
% of
the
total
bln
soums
% of
the
total
bln
soums
% of
the
total
bln
soums
% of
the
total
bln
soums
% of
the
total
1
2
3
4
5
6
7
8
9
10
11
Agricultural
output, bln
soums
399,9
100
9304,9
100
27164,2
100
34201,4
100
41261,4
100
Crop
production,
bln soums
197,7
49,4 5170,1
55,6
16506,8 60,8 21211,8 62,0 25152,6 59,0
Livestock
output, bln
soums
202,2
50,6 4134,8
44,4
10657,4 39,2 12989,6 38,0 16108,8
41
Source: The figures of State Statistics Committee of Uzbekistan.
There have been noticeable shifts in the structural constitution of crop production.
The main branches of crop production are cotton, grain, vegetable, melon, fruit, grapes
and potato production. Structural reforms in the agricultural sector eliminated the
monopoly of cotton, which was attained mainly by reducing the acreage under cotton
and the expansion of areas for other crops, such as grain-cereals crops. [7] In particular,
whereas 31% of the cost structure of crops in 2005 belonged to cotton, it had fallen by
2014 to account for 14%. Moreover, the production of other crops aimed to fully provide
the population with food was boosted. Specifically, the proportion of vegetables,
potatoes, fruits and grapes witnessed significant rise growing from 13%, 7% and 7% in
2005 to 24%, 19% and 12% in 2014 respectively. (Figure 3)

“Иқтисодиёт ва инновацион технологиялар” илмий электрон журнали. № 4, июль-августь, 2016 йил
7
www.iqtisodiyot.uz
Cotton; 30,8
Grain; 24,8
Vegetables; 13,3
Potato; 6,8
Melons; 2
Fruits and berries; 7,6
Grapes; 4,7
Others; 10,1
2005
Cotton; 14,2
Grain; 14,9
Vegetables; 23,7
Potato; 19,3
Melons; 4,4
Fruits and berries; 11,9
Grapes; 10,3
Others; 1,2
2014
Figure 3. The structure of crop production
Source: compiled by the author on the basis of the figures of the State Statistics Committee
of Uzbekistan.
Accordingly, the growth of the share of food crops amounted to 25.4 percentage
points, escalating from 59.2% in 2005 to 84.6% in 2014. Furthermore, the proportion of
potatoes expanded by 12.5 percentage points, vegetables – by 10.4 percentage points,
grapes – by 5.7 percentage points, fruits – by 4.3 percentage points, melons – by 2.4
percentage points
The developing sector of services in Uzbekistan is gradually becoming an
important economic activity with an impact on all aspects of life of society. The degree
of satisfaction of the population's needs for services is one of the main indicators of the
growing level and quality of life in a country. As a result of consistent measures to
reform the service sector, this branch of economic activity during a short time has
developed into the most dynamic sector of the economy. The share of services in GDP
has increased from 38.4% in 2005 to 54.5% in 2015 [1].
The service sector in Uzbekistan possesses a range of characteristics: high growth
rates, high capital turnover rate due to the short production cycle, the predominance of
small and medium-sized enterprises in the service sector, territorial segmentation and
local character.
The quality parameters and the structural composition of this sector are marked by
the prevalence of such traditional sectors as trade and catering, transport, public utilities
and personal services. So, in 2014 the services demonstrated a considerable growth

“Иқтисодиёт ва инновацион технологиялар” илмий электрон журнали. № 4, июль-августь, 2016 йил
8
www.iqtisodiyot.uz
largely at the expense of traditional industries, which accounted for 75.8% of the total
increase.
The natural tendency has been a decline in the share of traditional services in the
proportional distribution of market services: transport services dropped in proportional
terms (from 39.3% in 2006 to 26.9% in 2014) with a simultaneous increase in the share
of the current market services, such as financial (from 4, 0% in 2006 to 8.3% in 2014).
[1] The main factors that contributed to accelerating the market services were
represented by the introduction of new technologies, an increase in investments and the
development of small business, the growth of employment, incomes and consumer
demand. In recent years, consistent measures have been undertaken to foster the
development of services. The improvement of the structure of the service sector is
happening as a result of the advancement of new promising types – banking and finance,
insurance, information and communication services and others.
The introduction of the new information and communication technologies in the
servicing has stimulated positive qualitative structural changes manifested in the
dynamic development of new innovative industries: since 2006 – financial and banking
services, communication and information, travel services; since 2010 – repair and
maintenance of production equipment, healthcare, education, computer programming.
(Table 4)
Table 4
The structure of market services (%)
Indicators
Years
2007
2008
2009
2010
2011
2012
2013
2014
1
2
3
4
5
6
7
8
9
Market services
100
100
100
100
100
100
100
100
Communication
and IT
6,4
6,9
7,2
6,4
6,4
5,9
5,5
5,1
Computer
programming
n/a
n/a
n/a
0,08
0,14
0,14
0,18
0,23
Financial services
5,5
7,1
8
8,5
8,5
8,4
8,5
8,3
Transport services
35,5
33,3
31,7
32,5
30,1
29,4
27,7
26,9
Construction
services
n/a
n/a
n/a
4,5
4,4
4,2
4,5
4,8
Repair and
technical service
of technological
equipment
n/a
n/a
n/a
0,02
0,03
0,62
0,50
0,51
Repair and
technical service
of agricultural
machinery
n/a
n/a
n/a
0,09
0,09
0,13
0,12
0,13
Tourism
(including hotel
services)
0,47
0,5
0,5
0,4
0,4
0,5
0,5
0,5
Trade and public
18,3
17,3
17,2
18,9
21,0
22,0
22,4
22,9

“Иқтисодиёт ва инновацион технологиялар” илмий электрон журнали. № 4, июль-августь, 2016 йил
9
www.iqtisodiyot.uz
catering
Personal services
2
1,8
1,6
1,7
1,3
2,1
3,4
3,6
Education services n/a
n/a
n/a
2,4
2,4
2,7
2,8
2,6
Healthcare
services
n/a
n/a
n/a
0,72
0,74
0,93
0,97
1,03
Agricultural
services
n/a
n/a
n/a
n/a
n/a
n/a
0,73
0,62
Others
32,03
33,1
33,8
23,7
24,5
23,0
22,2
22,7
Source: IFMR Calculations on the basis of the figures of the State Statistics Committee, the
Trends of socio-economic development of Uzbekistan (2005-2014), Tashkent: IFMR, 2015 - 112 p.
As a result, the structure of market services has shifted to decrease the proportion
of traditional services, such as transportation (from 39.3% in 2006 to 25.4% in 2014),
and to boost the share of modern services, for example communication and IT services
(from 5.4% in 2006 to 15.6 in 2014). Innovative branches occupy a small portion in the
GDP (an average of 1 – 2% of GDP), but have a great potential of economic growth in
the long term.[1]
Thus, the sectoral structure of the economy of Uzbekistan showed certain patterns
that allow it to bring to the level of the developed countries. In particular, the sectoral
structure is characterized by the increased share of services and the reduced share of the
production of means of production in the sectoral structure of the economy.
Bibliography
1.
Karimov I.A. Our main goal is to go forward, consistently continuing the
ongoing reforms, structural changes in the economy, creating even more opportunities
for the development of private property, entrepreneurship and small business despite
difficulties, the Report of the President of the Republic of Uzbekistan Islam Karimov at
the enlarged meeting of the Cabinet of Ministers dedicated to the socio-economic
development in 2015 and the most important priorities of economic agenda for 2016 //
People’s word, January 17, 2016
2.
Тенденции социально-экономического развития Узбекистан (2005-2014)/
под общей редакцией д.э.н. А.М.Садыкова/Ташкент: IMFR, 2015 – 112 с.
3.
Decree of the President of the Republic of Uzbekistan № PP-1442 as of
December 15, 2010 "On the priorities of industrial development of Uzbekistan in 2011-
2015"
4.
Decree of the President of the Republic of Uzbekistan as of March 4, 2015 №
PK-4707 "On Program of measures of structural transformations, modernization and
technical re-equipment of production in the years 2015-2019"
5.
Decree of the President of the Republic of Uzbekistan as of February 11, 2015
№ PP-2298 "The program of localization of production of finished products,
components and materials for 2015 - 2019».

“Иқтисодиёт ва инновацион технологиялар” илмий электрон журнали. № 4, июль-августь, 2016 йил
10
www.iqtisodiyot.uz
6.
Decree of the President of the Republic of Uzbekistan "On measures to ensure
the program of structural reforms, modernization and diversification of production for
2015 - 2019" on March 4, 2015 № UP-4707
7.
Decree of the President of the Republic of Uzbekistan № PP-1758 as of May
21, 2012. "On the program of further modernization, technical and technological re-
equipment of agricultural production in the years 2012-2016"
8.
Decree of the President of the Republic of Uzbekistan № PP-1633 as of
October 31, 2011. "On measures for further improvement of the organization of
management and development of the food industry of the Republic of Uzbekistan in
2012-2015"
9.
Decree of the President of the Republic of Uzbekistan № PP-1446 as of
December 21, 2010 "On the acceleration of infrastructure development, transport and
communications construction in 2011-2015"
10.
Decree of the President of Uzbekistan as of April, 2000 "On measures to
attract foreign investment in exploration and production of oil and gas."
11.
Industry of Uzbekistan. Statistical Yearbook. - T.: State Statistics Committee
of Uzbekistan, 1997-2014.
12.
Uzbekistan in figures. Statistical Yearbook. - T.: State Statistics Committee of
Uzbekistan, 1997-2014.
13.
Construction in Uzbekistan, Statistical Yearbook, State Statistics Committee
of Uzbekistan, 1997-2014.
14.
Statistical Yearbook of Uzbekistan. Statistical Yearbook. - T.: State Statistics
Committee of Uzbekistan, 1997-2014.
15.
The economy of Uzbekistan. Statistical Yearbook. - T.: State Statistics
Committee of Uzbekistan, 1997-2014.