

180
1.
Шакиров,
Ильяс
Рахимзянович.
"ЛИ
КУАН
Ю–
ОСНОВОПОЛОЖНИК
СОВРЕМЕННОГО
СИНГАПУРА."
Научные разработки: евразийский регион
(2019):
54.
GEOGRAPHIC INFORMATION SYSTEM (GIS) AND UZBEKISTAN
HISTORY
Ueda Akira
PhD, researcher at the Institute of Developing
Economies JETRO in Chiba, Japan
What is Historical GIS?
Geographic Information System (GIS) is a category of computer software
that visualizes, integrates, compares, and calculates various data in a spatial
context. Recently, many pop1ular applications have integrated these functions.
Online map services that include shopping and restaurant information, GPS-
related pedometers and taxi service in smartphones are a type of GIS. Notably,
the COVID 19 crisis highlighted the utility of the GIS technique to visualize big
data. We have looked graduated colored maps that suggest a seriousness of
pandemic. ArcGIS and QGIS are common forms of GIS software used for
business and academic purposes [1]. Both software packages have a wide range
of spatial investigation functions. When GIS became popular in the 1980s,
historians began using this new tool, which many scholars now use [2]. In
general, the information collected from various historical sources is organized as
independent layers in a single GIS map. Comparing the layers allows the
visualization of the relationships between data and changes in regions over time.
GIS and Historical Sources
Historians face specific problems while using GIS, as historical data
usually do not contain latitude and longitude information [3]. Administrative
workers, sociologists, and even archaeologists can obtain the correct latitude and
longitude of objects using GPS. In many cases, historians have to rely entirely
on place names written in narrative sources. If they do have access to historical
maps, these are often without a geographic coordinate system. Place names
change over time; political regime changes often cause a place name change. All
post-Soviet countries experienced a series of place-name changes after the
Russian revolution. We can trace the history of renaming famous cities, but it is
difficult to reconstruct place-name changes in local and village areas. The
georeferencing process in GIS is designed to convert paper maps without
coordinate information into a digital format. The georeferencing process
transforms the paper map into a digital map by connecting known coordinates.
Known points consist of cities, roads, train stations, and capes that have not

181
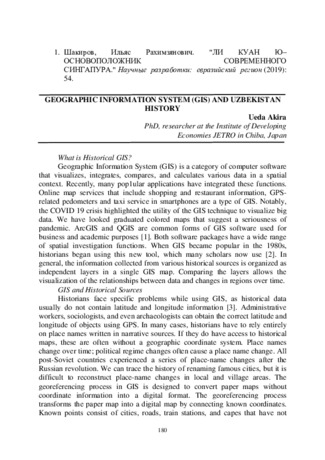
changed their locations. Figure 1 shows that a historical map around Andijan
was georeferenced with eight control points; six of them are the locations of
villages which names were maintained to this day and other two points are
railway junctions. By using georeferencing, we can add temporary latitude and
longitude to all places recorded only on old paper maps. Even if the result of the
first georeferencing is not perfectly correct, georeferencing is necessary for all
GIS users because GIS cannot work without latitude and longitude data. We can
correct incorrect locations in any phase after the first georeferencing.
Figure 1: How to integrate historical maps into GIS format
How To Use GIS in Historical Study
I would like to present three examples of historical GIS studies from my
work: visualization, time-series change, and spatial analysis [4].
1. Visualization

182
Figure
2
: Rainy and irrigated sowing in 1913 Source: author
The first example was chosen to demonstrate how GIS visualizes
historical data. I studied the characteristics of agriculture conducted by semi-
nomadic Kyrgyz people and tried to clarify the difference in agriculture between
sedentary and semi-nomadic people. Regarding historical sources, the Fergana
region is suited for quantitative analysis because the Russian empire annexed
this area by abolishing the Kokand Khanate in 1876 and conducted a series of
statistical surveys on population and agriculture [9].
The Russian empire conducted a land survey of Central Asian nomadic
and semi-nomadic regions to prepare for the colonization of Russian peasants
[5]. Though the purpose was problematic, the results of this survey remain a
very important historical source that recorded the economic activity of nomads
and semi-nomads before the Soviet reform of nomadic society. Figure 2 shows
that the semi-nomads in the foothills mainly engaged in rainy sowing (“bogara”
in Russian and “lalmi” in Uzbek), unlike the sedentary population in the Fergana
Valley. This difference cannot be explained only by natural conditions such as
precipitation because semi-nomads far from the valley prefer irrigated sowing. If
only the amount of precipitation had allowed the expansion of rainy sowing,
semi-nomads far from the valley would have expanded their grain production
with rainy sowing. This map raises the question of why semi-nomads near
sedentary areas prefer simple but unstable rainy sowing rather than irrigated
ones and, contrarily, why semi-nomads far from the valley did not expand rainy
sowing, despite experiencing enough rainfall. A narrative source explains that
the Kyrgyz semi-nomad engaged not only in agriculture and pasturage but also
in small trade and seasonal laborer in the valley. Kyrgyz semi-nomads multi-
income, maintained by the economic connection with the sedentary population,

183
enabled semi-nomads to expand ‘simple but unstable’ rainy sowing. This
suggests that connections with sedentary people allowed agricultural
development through the Kyrgyz semi-nomads.
2. Time series change
Figure 3: Ethnic data at the village level in the Fergana Valley Source: author
The second example shows how GIS reconstructs time-series changes.
Figure 3 shows how ethnic names in official statistics changed dramatically after
the Russian revolution and the establishment of Soviet Uzbekistan [6]. These
two maps were based on the list of settled points in Fergana province in 1909
and the All Soviet Census in 1926. The most evident change in the maps is the
disappearance of the Sart and its change to Uzbek. Although this phenomenon
has been well-researched in previous studies [7] the spatial characteristics of the
change are informative. For example, some non-Uzbek settlements changed to
Uzbek, while other settlements maintained the former ethnic name. This
difference did not occur randomly, but with some spatial tendency. Figure 3
shows that non-Uzbek settlements isolated in the former Sart /Uzbek area more
often changed their ethnic label in official statistics than in the non-Uzbek
dominant area. Another finding from Figure 3 is related to the population having
originated from East Turkestan/Xinjiang. They were recorded as Kashgar in
1909 and Uygur in 1926, but Figure 3 shows that the two categories did not
spatially continue. Many Kashgar settlements in 1909 were recorded as Uzbek-
dominant settlements in 1926, and most Uygur settlements in 1926 were
recorded as Sart dominant in 1909. Although the cause of this situation remains
unclear, it seems that mass refugees in Xinjiang in the 1916 revolt and their
return and the Uygur national movement after the Russian revolution might have
influenced this discontinuity [8].

184
3. Spatial analysis
Figure 4: Hotspot analysis on cotton planting in the Kokand oasis
Figure 4 shows how GIS can help researchers identify spatial tendencies
from historical raw data. Hotspot analysis indicates a statistically significant
area from the spatial dataset. This image suggests that hotspot analysis clarifies
where the cotton ratio is high in an oasis. The processed image (right) shows the
cotton monoculture district more clearly than the simple visualised law data
(left). This result can be compared to Figure 3. This comparison shows that
cotton monoculture in the Kokand oases expanded mainly in the peripheral area
of the oases. In addition to the Sart population in the eastern wing, both the
Karakalpaks in the north end and Uzbeks in the west wing participated in cotton
cultivation. It seems that Sarts located in the central part surrounding the
Kokand city were reluctant to participate in the cotton boom in the colonial era.
The three examples above indicate that GIS is suitable for demonstrating
certain tendencies in big data and evaluating the statistical significance of spatial
tendencies. In contrast, it is difficult to determine the cause and effect using GIS
alone. Hence, it is necessary to use narrative sources to argue for the cause of
any tendency in data. Traditional approaches to narrative sources do not lose any
importance. However, historical GIS allows us to utilize fruitful data recorded in
statistics. In other words, historians who adopt a traditional approach can use
only the last line of hundreds of pages of a statistic, but GIS historians can use
entire statistical tables for reconstructing past societies.
References:
1. ArcGIS (https: //www. esri. com/); QGIS (https: //qgis. org/)

185
2. See. I. N., Gregory, and A. Geddes eds.
Toward Spatial Humanities,
Historical GIS & Spatial History
(Bloomington: Indiana University Press,
2014).
3. Even if a historic map contains latitude and longitude information,
historians must conduct a georeferencing process on it. For example, see A.
Kitamoto and Y. Nishimura’s works on Aurel Stein’s maps. Kitamoto and
Nishimura’s other project on an old map of Beijing tells us that georeferencing
on a city consisting of numerous straight roads requests a different solution
(http://agora.ex.nii.ac.jp/~kitamoto/research/publications/cipa09a.pdf).
4. See below for more specific arguments on these topics. A. Ueda “The
demographic and agricultural development of the Kokand oasis during the
Russian Imperial era: nomad immigration and cotton monoculture,”
Asian
Survey
38,
no.
4
(July
2019):
510-530,
https://www.tandfonline.com/doi/abs/10.1080/02634937.2019.1631754;
A.
Ueda,
Cotton and Nomad: the GIS-based economic history of the Ferghana
region,
Hokkaido university press, 2020. (in Japanese); Jeanne Féaux de la
Croix et al. “Roundtable studying the Anthropocene in Central Asia: the
challenge of sources and scales in human–environment relations,”
Central Asian
Survey
,
Published
online:
08
Sep
2021,
https://www.tandfonline.com/doi/full/10.1080/02634937.2021.1960797.
5. The survey calculated the amount of excess (излишняя) land for the
future colonisation of Russian peasants (Материалы покиргизскому
землепользованию: Ферганская область: Наманганский уезд, 1913, С. IV).
The background of this survey was Pyotr Stolypin's famous reform at the center
of the empire (П.Н. Шарова, Переселенческая политика царизма в Средней
Азии, <<Исторические записки>>, Т. 8, 1940. С. 9).
6. Certainly, ethnic names in official statistics are only one aspect of the
ethnic identity of Central Asian natives. See. J.S. Schoeberlein-Engel,
Identity in
Central Asia : construction and contention in the conceptions of "Ozbek,"
"Tajik," "Muslim," "Samarquandi" and other groups
, Harvard University, 1994.
7. For example, see. F. Hirsch,
Empire of Nations: Ethnographic
Knowledge & the Making of the Soviet Union
, Ithaca: Cornell University Press,
2005; A. Khalid,
Making Uzbekistan; Nation, Empire, and Revolution in the
Early USSR
, Ithaca and London: Cornell University Press, 2015.
8. It is well-known that sedentary populations in Ferghana and Xinjiang
are very similar in language, religion, and social habits, and migration among
them was a common phenomenon. The ratio of the Ferghana population, which
originated in East Turkestan, might be extremely underrated in colonial and
modern statistics. See pages from 217 to 220 of С.Н. Абашин's “Чай в
Средней Азии: История Напитка в XVIII–XIX веках,” (С.А. Арутюнов и
Т.А. Воронина ред
. Традиционная пища как выражение этнического
самосознания
, Москва: Наука, 2001, С. 204–231.)


