


“Iqtisodiyot va innovatsion texnologiyalar” ilmiy elektron jurnali. № 6, noyabr-dekabr, 2021 yil
113
6/2021
(№
00056)
RESEARCH ON THE IMPACT OF FDI ON ECONOMIC GROWTH
AND MARKET SCALE BASED ON OLS (EVIDENCE FROM
UZBEKISTAN)
Zhang Lingzhi
PhD candidate at Tashkent States University of Economics, Uzbekistan
E-mail:
zlzcn@outlook.com
Abstract:
This study uses OLS to analyze the impact of FDI on Uzbekistan’s economic
growth and market size. The regression analysis results passed the 5% significance test. FDI
has a significant positive impact on Uzbekistan's economic growth and market promotion.
For every 1% increase in FDI, the increase in GDP is 0.44%; the increase in exports is 0.39%;
the increase in total capital is 0.51%; the reduction in national rate of unemployment is 0.21%.
FDI is necessary and effective for Uzbekistan.
Keywords:
OLS, FDI, GDP, Uzbekistan, Market expansion
Introduction
At present, FDI is still active on a global scale. FDI promotes the flow of capital and
technology on a global scale. It can not only bring a large amount of capital to the host
country, improve the level of human capital in the host country, but also bring advanced
technology and management experience to the host country. For foreign investors, it has
also promoted the development and expansion of overseas markets. Therefore, FDI is
currently an extremely important international economic activity on a global scale.
Uzbekistan's FDI and GDP growth
Duo to the stable political environment and the deepening of opening up to the
outside world, Uzbekistan's introduction of FDI has continued to increase. During the 28
years from 1992 to 2019, Uzbekistan imported approximately US$16.742 billion in FDI.
Especially from 2010 to 2019, a total of US$12.964 billion of FDI has been introduced in 10
years, and the scale has increased significantly. The introduction of FDI in the past 10 years
has accounted for 77.43% of the total in the past 28 years.
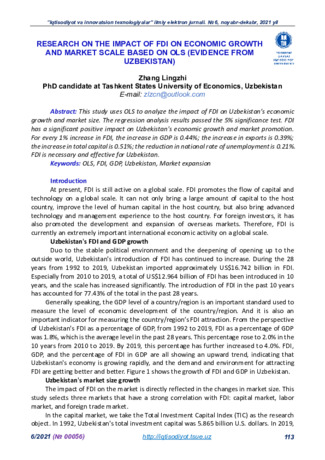
Generally speaking, the GDP level of a country/region is an important standard used to
measure the level of economic development of the country/region. And it is also an
important indicator for measuring the country/region’s FDI attraction. From the perspective
of Uzbekistan's FDI as a percentage of GDP, from 1992 to 2019, FDI as a percentage of GDP
was 1.8%, which is the average level in the past 28 years. This percentage rose to 2.0% in the
10 years from 2010 to 2019. By 2019, this percentage has further increased to 4.0%. FDI,
GDP, and the percentage of FDI in GDP are all showing an upward trend, indicating that
Uzbekistan's economy is growing rapidly, and the demand and environment for attracting
FDI are getting better and better. Figure 1 shows the growth of FDI and GDP in Uzbekistan.
Uzbekistan's market size growth
The impact of FDI on the market is directly reflected in the changes in market size. This
study selects three markets that have a strong correlation with FDI: capital market, labor
market, and foreign trade market.
In the capital market, we take the Total Investment Capital Index (TIC) as the research
object. In 1992, Uzbekistan's total investment capital was 5.865 billion U.S. dollars. In 2019,

“Iqtisodiyot va innovatsion texnologiyalar” ilmiy elektron jurnali. № 6, noyabr-dekabr, 2021 yil
114
6/2021
(№
00056)
this indicator rose to US$26.081 billion, an increase of 4.45 times over 1992, with an average
annual growth rate of 5.68%.
Figure 1 Uzbekistan's FDI and GDP growth
Data source: World Bank Open Data (https://data.worldbank.org/)
In the foreign trade market, we take the export trade value (EXP) indicator as the
research object. In 1992, Uzbekistan's export trade volume was 2.735 billion U.S. dollars. In
2019, this indicator rose to 14.024 billion U.S. dollars, an increase of 5.13 times compared
with 1992, with an average annual growth rate of 6.23%.
In the labor market, we take the National Rate of Unemployment (NRU) indicator as
the research object. In 2000, Uzbekistan’s national rate of unemployment was 12.06%. In
2019, this indicator dropped to 5.65%. Uzbekistan’s national rate of unemployment declined
rapidly from 2000 to 2007, and stabilized after 2007, showing an overall downward trend.
Uzbekistan's total investment capital and export trade volume showed an overall upward
trend during the 28 years from 1992 to 2019.
Figure 2 Uzbekistan's market size growth
Data source: World Bank Open Data (https://data.worldbank.org/)
These two indicators are positive indicators, and the increase in indicators means that
0,00%
0,50%
1,00%
1,50%
2,00%
2,50%
3,00%
3,50%
4,00%
4,50%
0
10
20
30
40
50
60
70
80
90
1992
1993
1994
1995
1996
1997
1998
1999
2000
2001
2002
2003
2004
2005
2006
2007
2008
2009
2010
2011
2012
2013
2014
2015
2016
2017
2018
2019
b
ill
ion
US$
FDI
GDP
FDI % of GDP
0
2
4
6
8
10
12
14
0
5
10
15
20
25
30
1992
1993
1994
1995
1996
1997
1998
1999
2000
2001
2002
2003
2004
2005
2006
2007
2008
2009
2010
2011
2012
2013
2014
2015
2016
2017
2018
2019
b
ill
ion
US$
FDI
EXP
TIC
NUR(%)

“Iqtisodiyot va innovatsion texnologiyalar” ilmiy elektron jurnali. № 6, noyabr-dekabr, 2021 yil
115
6/2021
(№
00056)
the capital market and foreign trade market have expanded during the reporting period. The
National Rate of Unemployment (NRU) is a negative indicator, and the decline in the
indicator means that the labor market has expanded during the reporting period. It can be
seen that the scale of the above three markets has shown an expanding trend during the
reporting period, which is positively correlated with the scale of FDI during this period.
Literature Review
On the whole, the theoretical research and empirical research of this type of research
are relatively rich. In many documents, the research on China's FDI import and export FDI is
concentrated. Guo Suzhen (2005) uses a combination of theoretical analysis and qualitative
analysis to study the economic impact and effects of China's attracting FDI. She pointed out
that the effect of FDI on regional economic development and the effect of regional economic
development on FDI are mutually reinforcing. Meng Qingqiang (2016) used fixed effects
analysis to analyze the relationship between FDI, human capital and economic growth, and
constructed a panel data model based on the data of FDI, GDP and employment rate of 11
provinces in the eastern coastal region of China from 1989 to 2013. The influence of FDI on
economic growth is analyzed, and it is concluded that the intermediary effect of human
capital makes FDI have a significant positive impact on the economic growth of eastern China.
Zheng Lei (2011) discussed China's investment in ASEAN countries and its economic effects
from the perspective of comparative advantage theory and economic effect theory, and
analyzed China's FDI investment drive in ASEAN countries from China's own economic
development needs and international economic development trends.
In addition, some scholars are concerned about FDI-related fields in developing
countries. For example, Li Taihuang (2012) used the method of empirical analysis to analyze
the economic impact and effects of FDI in Vietnam by constructing a VAR model, and found
that FDI has a positive impact on economic growth, employment rate pull, and technological
upgrading. Gu Lishu (2014) studied the FDI development of the four new ASEAN countries,
compared the scale and characteristics of China's investment in ASEAN countries with data
from 2001-2012 as a sample, and conducted an objective assessment of the investment risks
and opportunities of ASEAN countries.
Regarding Uzbekistan’s FDI, most of it is based on theoretical analysis and lacks the
integration of empirical analysis. Although many scholars in the world have paid attention to
Uzbekistan's economic development and its FDI attractiveness, they have not been able to
give a scientific and reasonable explanation with quantitative thinking. This research
combines the theories of economics and marketing and applies OLS to test the impact of FDI
on Uzbekistan's economy and market. From the perspective of enhancing the effect of
Uzbekistan’s FDI, this research gives marketing suggestions to promote economic growth,
expand market size, and enhance product competitiveness. Different from previous
researches focusing on FDI in Uzbekistan, this article adds research content on expanding
the market scale. Therefore, this article provides a valuable supplement to the research on
the effects of FDI in Uzbekistan.
As a developing country in Central Asia, Uzbekistan has practical needs to promote
growth and expand the market. Is FDI necessary for Uzbekistan? How much can the FDI effect
have on Uzbekistan’s economic growth and market size? This is the question that this
research needs to answer. In the OLS model constructed in this study, FDI is the independent
variable. The GDP, total investment capital, export trade volume and national rate of

“Iqtisodiyot va innovatsion texnologiyalar” ilmiy elektron jurnali. № 6, noyabr-dekabr, 2021 yil
116
6/2021
(№
00056)
unemployment are dependent variables. The model verifies the impact of FDI on economic
growth and market size, and draws the conclusion that FDI is necessary for Uzbekistan’s
economic growth and market expansion.
Research Methodology
Variable description
The method of this study is to capture the impact of FDI on GDP, export trade volume,
total investment capital, and national rate of unemployment through ordinary least squares
(OLS). The data from the World Bank supports this study's analysis of Uzbekistan from 1992
to 2019. The independent variable of the model is FDI. The dependent variables are GDP,
export trade volume (EXP), total investment capital (TIC), and national rate of unemployment
(NRU). According to the economic significance of the model, the natural logarithm of the
variable data is taken.
Model Specification
To verify whether FDI has an impact on Uzbekistan’s GDP, export trade volume, total
investment capital, national rate of unemployment. And how much impact it has. According
to the theoretical basis, the functional forms of the models related to FDI and GDP, FDI and
EXP, FDI and TIC, FDI and NRU used in this study are specified as follows:
Model 1:
The regression model of the impact of FDI on Uzbekistan’s GDP:
ln GDPij = α1 + β1 ln FDIij + e1
Model 2:
The regression model of the impact of FDI on Uzbekistan’s export trade:
ln EXPij = α2 + β2 ln FDIij + e2
Model 3:
The regression model of the impact of FDI on Uzbekistan’s total investment
capital:
ln TICij = α3 + β3 ln FDIij + e3
Model 4:
The regression model of the impact of FDI on Uzbekistan’s national rate of
unemployment:
ln NRUij = α4 + β4 ln FDIij + e4
In the formula, i represents a certain country and j represents a certain year of
observation. For the double logarithmic model, the economic significance of the variable
coefficients is very clear. α is intercept term. β represents the FDI elasticity coefficients of
GDP, export trade, total investment capital, national rate of unemployment. And e is random
disturbance term.
Analysis and Results
Model testing
Ordinary least squares (OLS) method of regression was used to evaluate the slope of
the coefficients of the autoregressive model. The use of OLS relies on the stochastic process
being stationary. In the case where the stochastic process is not stationary, the use of OLS
can result in invalid estimates. These estimates are called 'spurious regression' results thus
high adjusted R
2
values and high t-ratios yielding results with no economic meaning. Stata16
is used for estimation, and the statistical significance level of 5% is uniformly set in the model.
A total of 28 observations are included from 1992 to 2019 and 4 models are estimated to

“Iqtisodiyot va innovatsion texnologiyalar” ilmiy elektron jurnali. № 6, noyabr-dekabr, 2021 yil
117
6/2021
(№
00056)
capture the impact of FDI on GDP, export trade, total investment capital, national rate of
unemployment of Uzbekistan.
Estimation of Model 1:
The estimation of model 1 being the FDI on GDP is expressed in the functional form
below as:
Model 1:
ln GDP
ij
= α
1
+ β
1
ln FDI
ij
+ e
1
Adopting Stata16, the estimation result is provided in table 1 below.
Table 1 OLS Estimation of FDI on GDP from 1992 to 2019
(Model 1) lnGDP
Variable
Coef.
t
P>|t|
Std. Err
lnFDI
_cons
0.4442
15.3292
8.72
15.47
0.000
0.000
0.0509
0.9907
Adj R²
0.7355
F(1, 26)
76.09
prob>F
0.0000
Estimation of Model 2:
The estimation of model 2 being the FDI on export is expressed in the functional form
below as:
Model 2:
ln EXP
ij
= α
2
+ β
2
ln FDI
ij
+ e
2
Adopting Stata16, the estimation result is provided in table 2 below.
Table 2 OLS Estimation of FDI on export from 1992 to 2019
(Model 2) lnEXP
Variable
Coef.
t
P>|t|
Std. Err
lnFDI
_cons
0.3907
14.9021
11.96
23.44
0.000
0.000
0.0327
0.6357
Adj R²
0.8402
F(1, 26)
142.96
prob>F
0.0000
Estimation of Model 3:
The estimation of model 3 being the FDI on total investment capital is expressed in the
functional form below as:
Model 3:
ln TIC
ij
= α
3
+ β
3
ln FDI
ij
+ e
3
Adopting Stata16, the estimation result is provided in table 3 below.
Table 3 OLS Estimation of FDI on total investment capital from 1992 to 2019
(Model 3) lnTIC
Variable
Coef.
t
P>|t|
Std. Err
lnFDI
_cons
0.5105
12.6682
7.55
9.64
0.000
0.000
0.0676
1.3148
Adj R²
0.6749
F(1, 26)
57.06
prob>F
0.0000
Estimation of Model 4:
The estimation of model 4 being the FDI on national rate of unemployment is expressed

“Iqtisodiyot va innovatsion texnologiyalar” ilmiy elektron jurnali. № 6, noyabr-dekabr, 2021 yil
118
6/2021
(№
00056)
in the functional form below as:
Model 4:
ln NRU
ij
= α
4
+ β
4
ln FDI
ij
+ e
4
Adopting Stata16, the estimation result is provided in table 4 below.
Table 4 OLS Estimation of FDI on national rate of national rate of unemployment from
2000 to 2019
(Model 4) lnNRU
Variable
Coef.
t
P>|t|
Std. Err
lnFDI
_cons
-0.2090
1.3988
-7.06
2.36
0.000
0.000
0.0296
0.5927
Adj R²
0.7200
F(1, 18)
49.85
prob>F
0.0000
The 4 tables above show the estimation results for 4 models. The analysis result
indicates that all the signs of the coefficients are in line with the theoretical underpinning.
The t-ratios are more than 2, while all the probabilities are less than 0.05 which tells of the
significance of the variables. The F Statistic shows a significant result with probability of F
Statistic being 0.0000 which is an indication that the overall model is statistically significant.
The value of adj. R² is close to 1, showing that the model is good and hence captures the
maximum variations of the model.
Result analysis
Through the analysis of the impact of Uzbekistan’s FDI on economic growth and
market size, we have reached the following conclusions:
When this study applied OLS for verification, the regression analysis results passed
the 5% significance test, which ensured the validity of the results in the economic sense.
For Uzbekistan's economic growth, FDI has a significant positive impact on it. From
the economic significance of the regression results, for every 1% increase in FDI, the increase
in GDP is 0.44%. This result is consistent with the situation in most countries.
For Uzbekistan's market promotion, FDI also has a significant positive impact on it.
From the economic significance of the regression results, for every 1% increase in FDI, the
increase in exports is 0.39%; the increase in total capital is 0.51%; and the reduction in
national rate of unemployment is 0.21%.
The above results show that FDI has a significant role in promoting economic growth
and market expansion in Uzbekistan. FDI is necessary and effective for Uzbekistan.
Conclusion and Recommendations
Generally, FDI has a positive impact on a country's economic growth and market
expansion. Our conclusion supports its certainty in Uzbekistan. Under the premise that FDI
is necessary for Uzbekistan, we recommend:
◼
Formulate policies conducive to the introduction of FDI. These policies should be
consistent, effective and operable. Some key policies should be tried in the pilot area first,
and the policies should be revised according to the implementation effects to improve the
feasibility of the policies.
◼
Avoid the impact of FDI on domestic industries. When introducing FDI, private
investment and public investment should be defined. For Uzbekistan, FDI should be a
supplement to domestic investment for capital needs and technological innovation.

“Iqtisodiyot va innovatsion texnologiyalar” ilmiy elektron jurnali. № 6, noyabr-dekabr, 2021 yil
119
6/2021
(№
00056)
◼
Improve the investment environment. The transparency of laws and regulations
should be improved, the development of human capital should be promoted, market
liquidity should be improved, and a standardized capital market should be cultivated.
Reference
[1] World Investment Report. International Production Beyond the Pandemic.
UNCTAD. Geneva. 2020.
[2] Nigel Dtiffield, Katl Taylot. FDI and the Labor Market: a Review of the Evidence and
Policy Implications[J]. Oxford Review of Economics Policy, 2000(3) P90-103.
[3] Paolo Finigi and Holget Gotg. Multinational companies and Inequity Wages in the
host country: The case of Ireland[J]. Review of World Economics, 1999(1), P103-105.
[4] Magnus Blomsttom. Foreign Direct Investment and Employment: Home Country
Experience In The United States and Sweden[T]. NBET working paper, 1997, P5-10.
[5] Feliciano, Z. and Lipsey. The foreign ownership and wages in the United States,
1987-1992[T], Cambridge, MA: NBET Working Paper. 1999, P23-69.
[6] Kumat, N. Multinational Enterprises in India [N]. London: Touledge, 1990-08-23.
[7] Guo Suzhen. The impact of international direct investment on China's economy
[D]. Tianjin University of Finance and Economics, 2011: 29.
[8] Zheng Lei. Research on China's Direct Investment in ASEAN [D]. Dongbei University
of Finance and Economics, 2011: 128.
[9] Gu Lishu. Research on China's direct investment in the new four ASEAN countries
[D]. Dongbei University of Finance and Economics, 2014: 62.
[10] Meng Qingqiang. Research on the relationship between foreign direct investment,
human capital and economic growth [J]. Statistics and decision-making, 2016(4):174-176.