


Economics and Innovative Technologies. Vol. 2020, No. 1, January-February
150
1/2020
(№
00045)
MATRIX APPROACH TO FORMING A STRATEGY FOR THE
DEVELOPMENT OF INDUSTRIAL ENTERPRISES
Abdullaeva Matluba Nematovna
Ph.D., Associate Professor, Tashkent Institute of Railway Engineers
E-mail:
Abstract:
Strategic planning is an integral part of the organization’s functioning system.
Successful development of the enterprise is impossible, and effective strategic planning is also
impossible without matrix tools. The matrix method used in strategic planning allows you to
visually present the information being studied, as well as determine the correct line of behavior in a
particular situation. Matrix tools, for developing an enterprise development strategy is a set of
economic forecasting tools that allow to fully implementing the enterprise strategy in a market
economy.
Keywords.
Strategy, strategic planning, matrix, enterprise, portfolio analysis, competition,
business units, matrix tools, BCG matrices, PIMS, SPACE, GE / McKinsey, Shell / DPM.
Introduction
The market orientation of the industrial sector increasingly requires managers to be
able to see prospects and make effective strategic management decisions in the current
economic environment. At the same time, the growing instability of the conditions for
entrepreneurial activity, the specific features of the branches of activity objectively require
the development of an integrated system of strategic positioning of the enterprise.
Development of a development strategy for the enterprise is based on the use of
economic matrices. The matrix approach claims universality - it allows you to visualize and
conveniently present the information necessary for strategic management.
Analysis of the literature on the topic
Currently, some well-known scientists have developed a number of analytical
methods and models that can be useful in making strategic decisions. The most famous
among them are the Ansoff matrix, approaches to the analysis of competition by M.
Porter, the portfolio analysis matrix of the Boston Consulting Group (BCG), the consulting
firms McKincey and Arthur D. Little. In addition, the PIMS (Profit Impact of Market
Strategies) project should be highlighted.
So, for example B. Karloff characterizes the BCG matrix as a matrix with a high
degree of simplification [1]. But in our opinion, one can agree with the professor at
Harvard Business School M. Porter, who criticized this model, stressing that the market
share of companies and the growth of the industry market are by no means the only
criteria for profitability and prospects. According to Porter M., all strategies for creating
sustainable competitive advantages, one way or another, fit into three standard options:
• minimization of production costs;
• product differentiation;
• concentration on a specific market segment.
Each typical strategy promises only relative success, since it has not only
advantages, but also is fraught with risks [2].
The main problem of “typical” strategic

Economics and Innovative Technologies. Vol. 2020, No. 1, January-February
151
1/2020
(№
00045)
planning is the hope of a constant situation for a long time. When the situation suddenly
ch
anges, formal schemes built on the principle of “from analysis to action” turn out to be
useless.
In the 60-70s, As part of research at Stanford University, Albert Humphrey, a
business and management consultant, developed a SWOT analysis technique. The idea is
widespread and today it is presented in the works of many other authors. [3]. A SWOT
analysis (consideration of the company's strengths and weaknesses, opportunities and
risks) models the existing and potential position of the company depending on the given
strengths and weaknesses, as well as external opportunities and risks. He identifies the key
components of marketing information from a wealth of marketing audit data. This allows
the company to identify external opportunities and risks and compare them with its
strengths and weaknesses.
In strategic planning, a lot of matrices of one or another orientation are used. In this
regard, it becomes necessary to systematize the matrices used in strategic planning, as
well as the phased implementation of the matrix approach at all stages of strategic
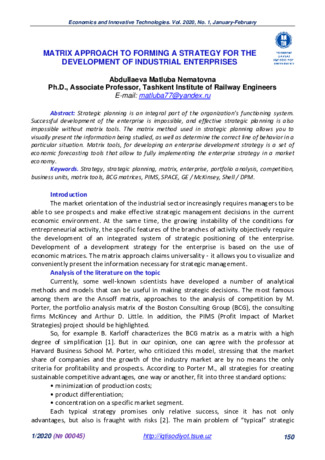
planning. Figure 1 shows the classification of matrices proposed by G. Loginov. [4]
Among the recognized and most common methods of strategic analysis are strategic
positioning models. Models based on the use of expert assessments: GE / McKinscy, Shell /
DPM, Hofer / Schendel and ADL, have many differentiated assessments of the state of the
organization’s business
[5].
However, even more concreteness can be achieved if, when determining the
strategic position of the business and developing recommendations, it is necessary to take
into account not only integral assessments of the attractiveness of the market and the
strengths of the organization as a whole, but also the differentiated assessments on the
basis of which they were determined. Taking into account the state of external factors of
market attractiveness contributes to the development of specific strategic orientations for
realizing current opportunities and overcoming threats. Taking into account characteristics
reflecting the degree of business success contributes to the formation of strategic
orientations towards the development of the relevant sides of the enterprise.
To implement this approach, Kulikov V.I. a matrix of differential strategic analysis
(DSA) is proposed [6]. This 3 * 3 matrix, as well as the GE / McKinsey matrix, is formed on
the basis of expert evaluations of the individual differentiated characteristics of market
attractiveness and business success.
However, unlike the GE / McKinsey matrix, the main purpose of the DSA matrix is
not integral, but a differentiated analysis of the strategic position of the business. And this
involves the construction of not only a common integrated matrix, but also many
differentiated matrices for individual businesses. Each positioned business is brought to its
own matrix field and is considered in a differentiated way:

Economics and Innovative Technologies. Vol. 2020, No. 1, January-February
152
1/2020
(№
00045)
Fig. 1. Classification of strategic planning matrices [4]
specific characteristics of the market attractiveness and the organization's
strengths.
But for this it is necessary that a certain characteristic of the organization’s
business strength corresponds to a certain characteristic of the attractiveness of the
market. Thus, the composition of the differentiated characteristics of the DSA matrix
should be formed on the basis of the principle of pairing in each area of assessment: size
and growth rate of the market
—
market share, industry rate of return
—
comparative
profitability, etc. (Table 1).
According to V.I. Kulikov, the market is all the more attractive, the more and with
less effort the organization can achieve its strategic goals. Therefore, an attractive
capacious and rapidly growing market, with a high profit margin, with a high commitment
of the buyer of relevant products and, at the same time, with a significant predominance
Classification
based on the Cell Number
(4 cells)For example:
matrix of the Boston
Consulting Group
(9 cells) for
example: General
Electric /
Mckinsey matrix
(more than 16 cells) for
example: matrix of an
organization’s economic
state vector
(16 cells) for
example: Hofer /
Shendel matrix
Classification
based on the
object of study
(Object of study -
company portfolio)
for example: matrix
Shell/DPM
(The object of study is
the marketing activity of
the company) for
example: matrix
marketing channels
(Object of study -
staff) for example:
awareness-relation
matrix
(Object of study -
product) for
example: matrix
quality-resource
intensity
(Quantitative)
For example: the matrix of the vector of
the economic condition of the
organization
Classification by information received
(Semantic)
For example: matrix of basic forms of
unions

Economics and Innovative Technologies. Vol. 2020, No. 1, January-February
153
1/2020
(№
00045)
of new opportunities over threats, less intense competition and a lower technological level
of production, which makes it easier to enter technology leaders.
The high attractiveness of the market in certain valuation areas means that the
organization has significant opportunities in this business. But their implementation
requires the development of the organization's respective strengths.
Given the low market attractiveness, opportunities are transforming into threats.
And this implies either a strategic retreat (up to leaving the market), or counteracting the
emerging threats also due to the development of the organization’s strengths. So the
decline in the market can be offset by an increase in the share of the organization on it.
Table 1
Characteristics of the attractiveness of the market and the strengths of the
organization’s business, taken into account when constructing the DSA matrix
[6]
Assessment Area
Market attractiveness
characteristics
Characteristics of the strengths
of an organization’s business
volume of sales
market size and growth rate
market share
business profitability
industry rate of return
comparative profitability
competition
intensity of competition
ability to compete in price and
quality of goods
customer commitment
customer commitment to this
product
customer commitment to
company products
change of situation
new opportunities and threats
competency to respond to
changing situations
technology
technological level of production
in the industry
company technological
capabilities
And the high technological level of this sphere of production with the technological
leadership of the organization from the threat becomes an opportunity, creating a
significant entry barrier for less technologically advanced competitors.
Thus, both high and low attractiveness of the market in certain valuation areas
makes an active strategy for developing the corresponding strengths of the organization
relevant.
Using the DSA matrix allows you to significantly expand the capabilities of matrix
strategic analysis, make it more specific, increase the justification for the formation of
strategic alternatives and choose a development strategy for the organization.
Research methodology
Theoretical and methodological foundations of the study are based on the findings
and suggestions of scientists in the field of strategic planning. The methodological basis for
solving these problems is the concept of strategic planning. In the course of the study, such
methods as portfolio analysis, matrix method, strategic tools for identifying enterprise
potential, SWOT analysis described in the works of economists were used.
Analysis and research results
The two-dimensional matrix developed by the Boston Consulting Group, known as
the Boston Consulting Group matrix, or BCG matrix, is widely used in the practice of
strategic choice. This matrix allows the company to classify products according to their
market share in relation to the main competitors and annual growth rates in the industry.
It makes it possible to determine which product of the enterprise occupies a leading

Economics and Innovative Technologies. Vol. 2020, No. 1, January-February
154
1/2020
(№
00045)
position in comparison with competitors, what is the dynamics of its markets, allows the
preliminary distribution of strategic financial resources between products. This matrix is
based on the well-known premise - the larger the share of the product on the market (the
larger the volume of production), the lower the unit costs per unit of production and the
higher the profit as a result of relative savings from production volumes.
As is known, the purpose of portfolio analysis methods is to help managers
understand the business, create a clear picture of the formation of costs and profits in a
diversified company.
This, in turn, requires a thorough analysis of the opportunities and threats for each
business unit (business unit). Portfolio analysis provides managers with a tool for analyzing
and planning portfolio strategies to determine the reasonable diversification of a
diversified firm. It also helps to introduce a common terminology and management
structure in order to facilitate communication within the company. One of the most
important areas of using the results of portfolio analysis is making decisions on the
restructuring of the company in order to use the opportunities that arise both within the
company and outside it. Approximately 75% of Fortune 500 companies and many smaller
companies with a wide range of products and services use some form of portfolio analysis
to shape their strategy.
The main method of portfolio analysis is the construction of two-dimensional
matrices with which business units or products can be compared with each other
according to criteria such as sales growth rates, relative competitive position, life cycle
stage, market share, industry attractiveness, etc. principles of market segmentation
(allocation of the most significant criteria based on the analysis of the external
environment) and analysis of the enterprise and coordination (pairwise comparison of
criteria). It should be noted that although different sets of variables are used in the
matrices of different consulting firms, they are still two-dimensional matrices, in which the
values of internal factors are fixed along one axis and external factors are recorded on the
other.
However, portfolio analysis is designed to solve the following problems:
•
coordination of business strategies or strategies of business units of the
enterprise. It is designed to ensure a balance between business units with quick returns
and directions that prepare the future;
•
distribution of human and financial resources between business units;
•
portfolio balance analysis;
•
establishment of executive tasks;
•
carrying out restructuring of the enterprise (merger, acquisition, liquidation and
other actions to change the management structure of the enterprise, expand or reduce the
business).
In all portfolio analysis matrices, the assessment of market development prospects
is determined on one axis, and the assessment of the competitiveness of business units on
the other. Typically, the process of portfolio analysis goes according to one scheme.
1. All activities of the enterprise are divided into strategic business units. The task of
identifying or identifying business units is quite complicated, especially for large
corporations. It is believed that a business unit should:

Economics and Innovative Technologies. Vol. 2020, No. 1, January-February
155
1/2020
(№
00045)
•
to serve the market, and not work for other departments of the enterprise.
Empirical studies of Western experts, in particular, the data of the PIMS project, indicate
that if more than 60% of the production unit’s products are used inside the company by
another production unit, it is advisable to consider these two units as one object for
strategic analysis purposes 1;
•
have their customers and competitors;
•
the management of the business unit must control the key factors that
determine success in the market.
2. The relative competitiveness of these business units and the development
prospects of the respective markets are determined. At the same time, different consulting
firms offer different criteria for assessing the prospects for market development and the
activities of business units in these markets.
3. A strategy is developed for each business unit (business strategy), and business
units with similar strategies are combined into homogeneous groups.
4. The management evaluates the business strategies of all divisions of the
enterprise in terms of their compliance with the corporate strategy, measuring the profits
and resources required by each division. Based on such a comparative analysis, it is
possible to make decisions on adjusting business strategies. This is the most difficult stage
of strategic management, where the influence of the subjective experience of managers,
their ability to predict and anticipate the development of environmental events, market
conditions and other factors is great.
Portfolio matrices allow you to summarize the results of strategy development and
present them in a visual form. The seeming simplicity of these methods is misleading, since
they require complete and reliable information about the state of the market, about the
strengths and weaknesses of the enterprise and its main competitors. The construction of
portfolio matrices involves a lot of work on market segmentation, on collecting
information that may not be explicitly available.
The main drawback of portfolio analysis is the use of data on the current state of
the business, which can’t always be predicted in the future. The differences in portfolio
analysis methods are in approaches to assessing the competitive positions of strategic
business units and market attractiveness. The best known approaches are those proposed
by the Boston Consulting Group (BCG portfolio matrix) and the McKincey consulting firm
(“business screen”). However, in any portfolio matrix, various types of busine
ss are
evaluated according to only two criteria, while many other factors (product quality,
investment, etc.) are ignored.
The Boston matrix, or the growth / market share matrix, is based on the product’s
life cycle model, according to which the product goes through four stages in its
development: entering the market (product is a “problem”), growth (product is a “star”),
maturity (commodity-
“cash cow”) and recession (commodity
-
“dog”). At the same time,
cash flows and profit of the enterprise also change: negative profit is replaced by its
growth and then a gradual decrease. Thus, the Boston matrix focuses on the positive and
negative cash flows that are associated with the various business units of the enterprise or
its products.
Therefore, the analysis based on the BCG matrix allows us to draw the following
conclusions:

Economics and Innovative Technologies. Vol. 2020, No. 1, January-February
156
1/2020
(№
00045)
• identify a possible strategy for business units or goods;
•assess their financing needs and profitability potential;
• assess the balance of the corporate portfolio.
•
When conducting portfolio analysis in practice, enterprise management may
encounter many problems of the methodological plan. In particular, in multi-product
companies it is difficult to identify business units, as well as to choose a limit dividing fast
and slowly growing types of business, it is difficult to group business units in order to
develop a unified development strategy, etc. Nevertheless, portfolio analysis is used in the
formation of corporate strategy due to its inherent advantages. Portfolio analysis has a
positive effect in the following areas:
•
stimulates senior management to separately evaluate each type of business of
the enterprise, set goals for it and reallocate resources;
•
provides a simple and clear picture of the comparative “strength” of each
business unit in the corporate portfolio;
•
shows how the ability of each business unit to generate a revenue stream, and its
need for funding;
•
stimulates the use of environmental data;
•
raises the problem of matching financial flows to the needs of business expansion
and growth.
In our opinion, the main drawback of the Boston Consulting Group approach is as
follows:
•only two dimensions are provided in the matrix
- market growth and relative
market share; many other growth factors are not considered;
• the position of a strategic business unit substantially depends on determining the
boundaries and scale of the market;
• in practice, it is not always clear how the growth of the market / market share
affects the profitability of the business;
• the interdependence of business units is ignored;
• A certain cyclical development of commodity markets are ignored.
The effectiveness of applying the BCG matrix lies in the ability to compare the
positions of enterprises in a single portfolio. With its help, you can identify the winners of
the "market leaders" and establish the degree of balance between enterprises in the
context of four quadrants of the matrix. Theoretically, enterprises operating in fast-
growing industries need a constant inflow of capital to expand their capacities. Units
operating in slowly growing industries, on the contrary, must have a surplus of cash [1].
This matrix is often used to assess the financing needs experienced by diversified
corporations and helps manage complex diversified associations. However, it should be
noted that it is not intended to identify criteria for success or a competitive situation in
various industries.
Traditionally, the SWOT analysis was presented in the form of a 2 × 2 matrix, which
is currently improved and includes more elements, in particular, a summary of the reasons
for good and bad work. SWOT analysis is the basis for determining goals and strategies,
and should be carried out at several levels: organization, each main market segment, each
main product / service, as well as competition. Information is included in the SWOT
analysis, depending on its significance and probability of use.

Economics and Innovative Technologies. Vol. 2020, No. 1, January-February
157
1/2020
(№
00045)
As it is known, the SPACE matrix is the best method for analyzing the competitive
position of an enterprise, which determines the strategic position of an enterprise in the
industry using two internal indicators (financial stability and competitive advantage) and
two external indicators (industry stability and stability of external conditions) [7]. Each of
these indicators can be characterized by a set of criteria. For example, the “competitive
advantages” group will include criteria such as market share, product quality, its life cycle,
and others. The authors of the methodology propose to evaluate each of them on a six-
point scale, and based on this, derive the average statistical score of the indicator.
Thus, the strategic position of a company is generally classified as aggressive (the
market is growing, the economy is stable), competitive, conservative (the market is
stagnating or shrinking, but the economic conditions are stable) or defensive. The SPACE
matrix can be used on its own or as a basis for another analysis (for example, SWOT
analysis, industry analysis or evaluation of strategic alternatives).
The GE / McKinsey matrix (for analyzing the business portfolio) - a multifactorial
approach to strategies based on the structure of the asset portfolio, is a response to the
BCG matrix. The criteria for this two-dimensional matrix are the attractiveness of the
industry and the sustainability of the enterprise, which depend on many factors. Table 2
summarizes the criteria for industry attractiveness and enterprise sustainability for GE and
McKinsey.
It should be noted that regardless of the selected criteria, an assessment should be
made on them, allowing to determine the degree of attractiveness of the industry and the
significance of the advantages of the enterprise. The circles representing individual
strategic business units of the company’s portfo
lio are entered into the matrix depending
on their location on the axes of enterprise stability and industry attractiveness. The size of
the circles is proportional to the size of the industry, and the parts of the circle that are in
the shadow are proportional to the share of the strategic business unit on the scale of the
industry in which it competes.
Table 2
Variables Used in the McKinsey Model [7]
CHARACTERISTICS OF THE ORGANIZATION'S
STRENGTHS (X AXIS)
MARKET APPEAL CHARACTERISTICS (Y AXIS)
•
RELATIVE MARKET SHARE
•
MARKET SHARE GROWTH
•
DISTRIBUTION NETWORK COVERAGE
•
DISTRIBUTION NETWORK EFFICIENCY
•
STAFF QUALIFICATIONS
•
CUSTOMER LOYALTY TO THE COMPANY
•
TECHNOLOGICAL ADVANTAGES
•
PATENTS, KNOW-HOW
•
MARKETING BENEFITS
•
FLEXIBILITY
•
MARKET GROWTH RATES
•
PRODUCT DIFFERENTIATION
•
COMPETITION FEATURES
•
INDUSTRY PROFIT MARGIN
•
CUSTOMER VALUE
•
CONSUMER BRAND LOYALTY
To study the current situation, the company can put its product or company in the
matrix. Forecasts for the future can be compared with the current situation and thus

Economics and Innovative Technologies. Vol. 2020, No. 1, January-February
158
1/2020
(№
00045)
determine the difference between the desired and possible results. For all combinations of
market attractiveness and competitive advantage, at least one strategy can be chosen.
Depending on the results of the analysis, the company has four options for strategies:
investment in conservation, investment in development, investment in restoration and
investment in self-elimination. Markets of goods, characterized by both good
attractiveness and stability of the enterprise, are most promising for profit.
At the corporate level, they analyze the businesses within the corporation, i.e. help
to carry out portfolio analysis, as well as analysis of the situation in the corporation as a
whole, to solve global issues. The business level includes diagnostics, which is related to a
competitive business unit and most often refers to one product, analyzes the properties of
this product, the situation on the market for this product, etc. The functional level
examines the factors affecting the functional areas of the enterprise, of which the most
important are marketing, personnel management [8,9].
Analysis at the corporate management level of the enterprise includes solving global
issues related to the company's strategy, mergers and acquisitions, staff reductions, the
introduction of a new information system, etc. At this managerial level, it is possible to
diagnose the use of resources in various activities of the enterprise. For example: an
analysis of an information resource from the point of view of three types of company
activities at the corporate level in a particular case allows us to establish that the company
needs a new information system. Exploring this resource at a business level, i.e. at the level
of a separate unit, it is established that in this unit, to ensure effective activity, it is
necessary to develop new components of the information system. At the next functional
level (be it marketing, personnel management), the diagnostics of the use of the
information resource is also carried out and the component of the information system that
is required specifically for this functional area is determined [10].
For example, timely monitoring of the use of labor resources at the corporate
managerial level from the point of view of the production type of activity allows us to
justify the need to attract new specialists to this industry, to improve the skills of existing
specialists. At the business level, monitoring proves that at the level of the analytical type
of activity of the enterprise, there are not enough specialists to provide an effective
analysis of the situation on the market of a particular business unit.
Conclusions and offers
Based on the foregoing, we can draw the following conclusions: at the corporate
level, to ensure the efficiency of the production activity of the enterprise, it is necessary to
develop a program for ensuring the raw material safety of the enterprise; at the business
level, it is advisable to develop a program to reduce raw materials costs at all stages of
production activity; at the functional managerial level (personnel management) ensure
timely and effective communication of information to employees.
Along with this, it should be noted that in order to ensure the effective
development of the enterprise, the monitoring process should be carried out regularly. By
analyzing the components of the matrix, you can see the full picture of the enterprise’s
activities, the processes of using resources, determine the development strategy of the
enterprise, ensure the best use of resources, reduce costs, improve mutual understanding
of management and ordinary members of the team.

Economics and Innovative Technologies. Vol. 2020, No. 1, January-February
159
1/2020
(№
00045)
Matrix tools is one of the most effective means of analyzing an enterprise, as well as
forming an enterprise development strategy. The three-dimensional complex of matrix
tools for strategic planning of an industrial enterprise is a visual object for determining the
applicability of matrices. Using the example of this complex, we can understand which
areas of the matrix tools are promising, which are currently almost unexplored, and which
should be paid attention.
References
1. Karloff B. Business Strategy: Trans, from English. - M.: Economics 2002. - 239 p.
2. Porter M. Competition: Trans. from English: Textbook. - M.: Williams, 2006. - 495
p.
3. Jenster P., Hassi D. Analysis of the strengths and weaknesses of the company.
Identification of strategic opportunities. - M.: Williams, 2004. - 504 p.
4. Loginov G.V., Popov E.V. Matrix methods of strategic planning of the enterprise.
Preprint Ekaterinburg: 2003.-158 p.
5. Thompson A.A. ml., Strickland A.J. Strategic management: concepts and
situations. M: INFRA-M, 2000.S. 266-301; Efremov V.S. Business strategy. Concept and
planning methods. M.: Finpress Publishing House, 1998. P. 66-110.
6. Kulikov V.I. Regulation of production activity of the organization. M.: Science,
monograph. 2004.352 p.
7. Chizhov L.N., Lagunova E.V. Modeling the process of strategic analysis of an
industrial enterprise // Vestnik TSEU. - 2007. - No. 2. - P. 37-51.
8. Barinov V.A. Strategic Management: Textbook / V.A. Barinov - M.: INFRA-M,
2013. - 285 p.
9. Goremykin V.A. The economic strategy of the enterprise: Textbook. Publ. 3rd ed.
And additional - M.: Publishing house "Alpha-press". 2007. - 544p.
10. Ibragimova M.Kh. Analysis of the external environment of the company for
strategic decisions / M.Kh. Ibragimova // Problems of the modern economy. 2012. No. 2. -
FROM. 140
–
143.
11. Efremov, B.C. Strategic planning in business systems / B.C. Efremov. - M.
Publishing House Finpress, 2010.
–
204p.