

SIGNIFICANCE, DEVELOPMENT DYNAMICS AND
PROSPECTS OF HIGHER EDUCATION IN THE FIELD OF
SERVICES.
Mamatov Akhmetjon
1
, Mamatov Mamajan
1
, and Turgunov Doston
1
1
University of Tashkent for Applied Sciences, Gavhar Str. 1, Tashkent 100149, Uzbekistan
Tashkent State University of Economics, Islom Karimov Str. 49, Tashkent 100066
(mamatovahmadjon@rambler.ru, m.mamatov@tsue.uz,
https://doi.org/10.5281/zenodo.10467730
Keywords:
Higher educational institutions, educational services, educational services market, competition, gross
domestic product, gross services, forecasting, exponential smoothing method, regression equation.
Abstract:
The development of the higher education system in the Republic of Uzbekistan, as well as the growth of
higher education services in the volume of gross services and gross domestic product, its dynamics are
analyzed and forecasts are developed on its basic, inertial and mobilization perspectives.
1 INTRODUCTION
The economy of the 21st century has been
characterized by several trends along with potential
changes and developments that are shaping the way
we live and work. This is not only due to the modern
technological revolution and the genesis of new
technological structures, but also to the qualitative
changes affecting the person himself (needs, motives,
goals, etc.) and the content with his work. The
development of knowledge on intensive production
led to the acceleration of the transition from
reproductive industrial labor, which dominated the
previous centuries, to mainly creative labor. These
transformation processes gave rise to a change in the
place and role of education in the economy.
Education has long become a sphere of social
production, in which the main resource and potential
for human creativity development have been formed.
The basis of the decree of the President of the
Republic of Uzbekistan dated October 8, 2019 "On
approval of the concept of the development of the
higher education system of the Republic of
Uzbekistan until 2030" - number PF 5847 [1], the
concept of the development of the higher education
system of the Republic of Uzbekistan until 2030 was
adopted. The concept is aimed at improving the
quality of education, training competitive personnel,
and effective organization of scientific and innovative
activities based on the needs of the social sphere and
economic sectors, ensuring the solid integration of
science, education and production.
This is the aspect which President of the Republic
Uzbekistan Sh.M. Mirziyoev specifically mentioned
with the following points: 65 academic lyceums will
be transferred to higher education institutions in order
to strengthen the cohesion between universities and
lower levels of the educational system. Also, 187
technical schools will be attached to related
universities and network enterprises in their field [2].
A distinctive feature of this strategy is the
development of public-private partnership in the field
of higher education, the establishment of branches of
state and non-state HEIs in the regions, including the
branches of prestigious foreign HEIs.
The educational service budget is the demand for
educational services of the main economic entity
(individual, household, household and organization,
state) and the provision of this service by the general
educational organization is considered as a basic
requirement, and these higher education services
contribute to the national economy and its
determining and assessing the impact on the gross
services sector is of urgent importance.

2 Review of literature
The scientific-theoretical basis of increasing the
volume and quality of higher education services,
training competitive personnel, effective organization
of scientific and innovative activities on the basis of
ensuring a solid integration of education and
production,
foreign
scientists
B.A.Lundvall,
J.K.Galbraith, R.Nelson, G.B. Klyder, D. Mandel, K.
Freeman and other scientific research works can be
cited.
Among the Russian scientists are A. A.
Porokhovsky, Yu. P. Anisimov, S. Yu. Glazev, O. G.
Golichenko, A. A. Dinkin, Beketovn. V., Yu. V.
Erigin, B. N. Kuzik, N. I. Ivanov, V. M. Polterovich,
I. V. Shevchenko, Yu. V. Yakoves and others have
conducted research on this topic.
Scientific-theoretical aspects of improving the
volume and quality of higher education services,
training competitive personnel, effective organization
of scientific and innovative activities on the basis of
ensuring a solid integration of education and
production in the Republic of Uzbekistan. Toychieva
O.M., Usmonov B.Sh., Shukurullaev U.U., Azizov
S.R., Khudaynazarova D.Kh., Khojaev A.S.,
Djumaniyazov U.I., Nabiev D.A., Vakhobov A.V.
and others can be distinguished in this field.
The concept of "network structure" in the higher
education system was coined by B.A. Lundvall[3].
The interconnectedness of this concept determines
the diversity of approaches to defining the nature of
the network structure. A networked structure is
governed by long-term single goals related to certain
integration relations for the most efficient use of its
resource potential. Network structures differ from
traditional structures in almost all the basic principles
of operation. The most important features that
distinguish network structures from hierarchical and
market structures in the higher education system and
the first classification of the network structure,
considered classical, were proposed by P. Miles and
Ch. Snow [4].
According to Russian scientists S.L. Parfenov,
considering higher education institutions, the
structure of the educational network, formed by a set
of organizations that implement educational projects
together, is also aimed at building mutual cooperation
with large scientific centers and the real sector of the
economy. Such a network structure revealed that the
main form of interaction is a consortium of business
communities and a cluster of higher education
institutions, academic institutions and associations
[5]. As reported by Professor Makoveev V.V. in
higher education institutions, "integrative network
structures are of special importance for establishing
integrative relations among science, education and
production, and the activities of its participants:
fundamental research – REDW (research and
experimental design work) - experimental production
- mass production - sales" scientifically justified that
it is aimed at covering the innovation cycle" [6].
Zufarova N.G., an economist from Uzbekistan. In
higher education institutions, "universities are at the
central link of mutual cooperation, and they are the
main stems of innovations[7]. Among the young
economists
in
our
country,
A.Sultanov,
U.Djumaniozov and K.Khalmuratov paid special
attention to public-private partnership as a form of
branch structures in higher education institutions, and
in their scientific work, bearing in mind public-
private partnership based on the long-term strategic
tasks and goals of the state, public-private partnership
is a long-term strategic task of the state, and based on
their goals, on the basis of various possible economic,
political, social, cultural and considering other risks,
dangers, risk distribution, with the private sector,
extremely
important
socio-economic
for
the
population, if necessary, projects and relations with
the private sector are mutually beneficial to build
politically important objects, introduce innovations in
the fields, and provide services" [8]
.
2.1
Research methodology
The article includes dialectical, systematic,
integral and synergetic approaches, economic,
logical, scientific abstraction, analysis and synthesis,
modeling of economic processes and systems,
induction and deduction, comparison, generalization,
grouping,
graphical
econometric
modeling,
exponential smoothing method, regression equation
methods were used.
2.2
Analysis and discussion of
results
The higher education system is an important pillar
that increases the country's national wealth and
competitiveness. In accord with experience of
developed societies, in order to ensure sustainable
economic growth, 40-50 percent of the population
should possess at least higher education, and in the
knowledge economy, the percentage of highly
educated people reaches 60 percent. In this regard, the
President emphasized the following: improving the
quality of education is the only correct way of
development of the new Uzbekistan [9]. Particularly,
in the concept of development of the higher education

system of the Republic of Uzbekistan until 2030,
raising the process of training independent-thinking,
highly qualified personnel with modern knowledge
and high moral and ethical qualities to a new level in
terms of quality, modernization of higher education
the task of developing the social sphere and economic
sectors based on advanced educational technologies.
The development of stable market relations in our
country is inextricably linked with the emergence and
development of the educational services market.
Formation of the educational services market is a
complex process. Understanding education as a
service and its entry into the market includes financial
relations between the subjects of the market of
educational services. Education will become a
separate service sector of the market, and the tax-
paying citizen will receive the right of a customer,
demanding the improvement of the quality of the
services provided, taking into account the needs of
consumers and their legal representatives.
As competitive factors in the market of
educational services, the standard of living, the
structure of employment, the rate of development of
socially important fields and practices, etc. can be
cited. Educational services are exchanged in the
market as a type of market service, which is
understood as a set of existing and potential buyers
and sellers of goods. The educational services market
is the demand for educational services of the main
economic
entities
(individuals,
households,
enterprises and organizations, the state) and their
delivery by various educational organizations,
considered as an interacting market.
In modern market conditions, the nature of the
relationship between the citizen and the state is
changing. Education becomes a service sector, and
the tax-paying citizen takes the right of the customer
and demands the improvement of the quality of the
services provided, taking into account the needs of
consumers and their legal representatives.
Currently, higher education institutions in the
Republic, which have been granted financial
freedom, are competing with each other in the rival
for students, because the choice of legal
representatives can provide educational conditions
that meet the new state educational standards and
provide various quality educational services, aimed at
educational organizations that can provide.
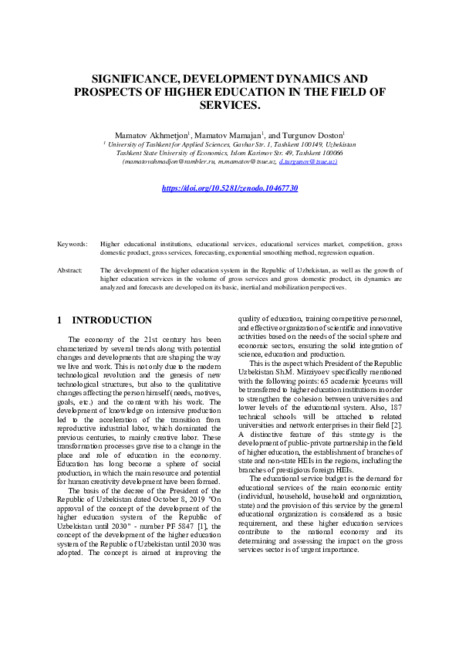
Picture 1. Dynamics of the number of higher education
institutions in the Republic of Uzbekistan (2010-2021).
The number of higher education institutions in the
republic was 154 in 2021, and by 2022 there will be a
total of 186, including 34 universities, 48 institutes, 3
academies, 27 branches, 1 conservatory, foreign 31
branches of the national higher education institution
and 42 non-state higher education institutions are
operating[10]
.
The number of republican higher education
institutions increased from 65 in 2010 to 154 by 2021,
and the number of students studying in them
increased by almost 3 times to 808,000. In 2012, the
number of higher education institutions in Tashkent
decreased by 1.
Picture 2. Dynamics of the number of higher education
institutions in the regions of the Republic of Uzbekistan
It can be seen that the increase in the number of
higher education institutions operating in the republic
has increased from year to year, which corresponds to
the general market trend, and the leader in the ranking
of the number of higher education institutions by
region is the city of Tashkent, in 2021 there are 51
higher education institutions in it, which is 40.2% . In
the Samarkand region - 12 (9.4%), in the Fergana
region - 10 (7.9%), in the Republic of Karakalpakstan
- 9 (7.1%), and in the Syrdarya and Navoi regions - 2
higher education institutions. is 1.6% compared to the
total number.
When looking at a number of important aspects in
the field of education, it has become the foundation
for human development and technological changes of
the economy, it provides the regions with labor force,

on the other hand, it helps to develop the
competitiveness of the subjects of the Republic.
Econometric models were used to analyze the
position of higher education services in the service
sector.
Modeling and forecasting of socio-economic
processes in the conditions of the market economy is
the scientific knowledge of the past, the future based
on the development laws and trends of the present
time, and the determination of future development
goals and objectives. Forecasting is of great
importance in the theory and practice of managing the
country's economy. This science serves as a basis for
choosing management solutions, determines ways of
influencing economic processes in the present to
achieve future goals.
"Forecasting" has been chosen as another stage of
the process of regulating the economy or part of the
development of the economic and social development
program of the country. At the same time, it is a
relatively independent science, distinguished by
several characteristics: firstly, forecasts are not
directive in nature, their quantitative estimates are
mainly probabilistic in nature, they are aimed at
identifying development problems that have occurred
on a large scale and looking for ways to solve them.
In our research, we used the exponential
smoothing method to determine the future share of
higher education services in the service sector and in
the GDP of the Republic. According to Allen L.
Webster, the use of moving average series,
exponential smoothing, and linear trend equations in
time series smoothing shows the necessity of using
linear regression trend equations in time series
forecasting [11].
There are various methods of time series
smoothing and time based forecasting, the most
commonly used are:
1. Method of extending the indicator period;
2. Average sliding method;
3. Exponential smoothing method;
4. Trend equations.
The method of extending the period of the
indicator is carried out by calculating the weighted
average within recent years for long periods and
forecasting that average for the next period.
The exponential smoothing method is a method of
smoothing time series based on the quantities of
recent periods and the exponential parameter, and it
is more convenient for developing predictions for the
near future.
The formula for the exponential smoothing
method is as follows:
𝑦
𝑛+1
= 𝑦
𝑛
∗ 𝛼 + (1 − 𝛼) ∗ 𝑦
𝑛−1
(1)
Where: y_(n+1)
–
smoothed or projected period
information;
y_n
–
current period information;
y_(n-1)
–
basis (past) period observations.
α –
exponential leveling parameter.
Exponential leveling parameter the following
formula with is:
𝛼 =
2
𝑚+1
(2)
As can be seen, depending on the size of α, the
severity of the previous observation decreases
rapidly. The larger α is, the smaller the effect of
previous years. If α is close to number one, only the
influence of the last observations can be taken into
account in this forecasting, and if it is close to zero,
the weight measured at the time series levels will be
very slow. All previous periods and observations are
taken into account in forecasting.
At this point, it should be said that in some
literature, the data of the current and past periods are
presented directly in absolute amounts, while in some
literature, the current and past periods are
arithmetically represented instead of the current data.
The average amount, instead of the information of the
previous period, the arithmetic average of the
amounts of the previous and previous year is taken.
The average relative error (e) in the data obtained
as a result of exponential smoothing is determined by
the following formula:
ε =
1
𝑛
∗ ∑
|𝑌
𝑝𝑟
− 𝑌|
𝑌
∗ 100
𝑛
𝑖=1
(3)
In the interpretation of the values to evaluate the
forecast accuracy of the mean relative error, if ε is less
than 10, the forecast accuracy is high, in the range of
10-20, the accuracy is good, in the range of 20-50, the
accuracy is satisfactory, and when it is greater than 50
accuracy is considered unsatisfactory.
The trend method of forecasting is one of the most
widespread methods, which is a linear trend equation
in its simplest form, but in our research we used a
regression equation in the form of a second order
parabola. Because in the following years, due to the
increase in the number of higher education
institutions and the increase in the demand for higher
education services, there was a sharp increase in the
service sector (Fig. 1).
𝑌 = 𝑎 + 𝑏 ∙ 𝑡 + 𝑐 ∙ 𝑡
3
(4)
Here: Y - result;
a , b , c - regression equation parameter;
t - time series

The values of a, b and c are found by using the
least squares method to represent the system of
equations.
{
∑ 𝑦 = 𝑛 ∙ 𝑎 + 𝑏 ∙ ∑ 𝑡 + 𝑐 ∙ ∑ 𝑡
2
∑ 𝑦 ∙ 𝑡 = 𝑎 ∙ ∑ 𝑡 + 𝑏 ∙ ∑ 𝑡
2
+ 𝑐 ∙ ∑ 𝑡
3
∑ 𝑦 ∙ 𝑡
2
= 𝑎 ∙ ∑ 𝑡
2
+ 𝑏 ∙ ∑ 𝑡
3
+ 𝑐 ∙ ∑ 𝑡
4
(5)
The created equation (model) is evaluated
according to the following criteria:
a) Determination coefficient;
b) Fisher criterion;
c) Student standard;
g) Darbin-Watson criterion;
d) Approximation error.
Trend of models quality determination coefficient
the following formula defined by :
𝐷 = 𝑅
2
=
𝐸𝑆𝑆
𝑇𝑆𝑆
(6)
The value of the coefficient of determination is
determined according to the Chedok scale, and
according to it, it is between 0 and 1, and the result
close to 0 means that the connection between the
events is weak, 0 means that there is no connection at
all, and 1 Close to .0 means that the association is very
strong.
This where:
𝐷 = 𝑅
2
-determination coefficient;
ESS- value of random variation ( explained
amount of squares);
TSS- total variation value ( total sum of squares ).
The statistical significance of the model is
determined by Fisher's F-criterion (F):
𝐹 =
𝐸𝑆𝑆∗(𝑛−𝑚−1)
𝑅𝑆𝑆∗𝑚
(7)
This where: n- number of observations;
m - factor number of variables ;
RSS - trend variation value ( residual sum of
squares ).
The statistical significance of the regression
coefficients is tested by Student's
𝑡
test.
𝑡
𝑎
=
|𝑎|
𝑆
𝑎
(8)
𝑆
𝑎
2
=
𝑆
𝜀
2
∑
(𝑡
𝜀
−𝑡)
2
𝑛
𝑖=1
(9)
The accuracy of the model is calculated using the
average relative error (A) of the approximation:
𝐴 =
1
𝑛
∗ ∑
|
𝜀
𝑖
𝑌
𝑖
|
𝑛
𝑖=1
∗ 100
(10)
There should be no autocorrelation between the
time series values, which is checked using the Darbin-
Watson criterion:
𝑑 =
∑
(𝜀
𝑖
−𝜀
𝑖−1
)
2
𝑛
𝑖=1
∑
𝜀
𝑖
2
𝑛
𝑖=1
(11)
The Darbin-Watson scale allows for a range of 0-
4. It oscillates around 2.0 if there is no autocorrelation
between the row values.
When the found value is checked by the table
value, it has autocorrelation d_real<d_low, if it has
autocorrelation, d_real>d_highif there is no
autocorrelation, d_low<d_real<d_highthen the check
is continued.
Based on the developed model, a forecast for the
coming years is prepared. In this case, the forecast
indicators are required to be located in the upper and
lower range of the forecast developed for the next
period.
Y_((t_0))-
t_naz∙S_yx≤forecast indicator≤Y_((t_0
) )+t_naz∙S_yx(12)
Here: Y_((t_0))-current period information;
t_naz-Theoretical value according to the Student
criterion;
𝑆
𝑦𝑥
= 𝑆
𝜀
2
(
1
𝑛
+
(𝑡
𝑛+1
+𝑡)
2
∑
(𝑡
𝑖
+𝑡)
2
𝑛
𝑖=1
)
(13)
Table 1
Changes in country's GDP, volume of services
and gross educational services in 2010-2021
The year _
Vol. of
country's
GDP,
bln
soums
Total
services,
bln
soums
Higher
education
services,
bln
soums
2010
78936.6
31463.8
1412.9
2011
103232.6
40529.1
1682.1
2012
127590.2
50254.7
2070.0
2013
153311.3
62099.2
2459.7
2014
186829.5
73600.9
2917.3
2015
221350.9
86674.5
3435.4
2016
255421.9
99665.5
4034.9
2017
317476.4
116901.5
6057.8
2018
424728.7
147587.2
8292.6
2019
529391.4
204874.5
10616.6
2020
602193.0
233048.7
12043.9
2021
734587.7
283550.0
16020.1
The change is 2021
compared to 2010
9.3
9 , 1
11.3
Between 2010 and 2021, the country's GDP
increased by 9.3 times, total services by 8.3 times, and
higher education services by 11.3 times. Over the past
12 years, total services have increased more than
higher education services, indicating that services in
higher education have increased more than other
types of services.
In our study, the number of observations is equal
to the studied period, i.e. 12, and the exponential
smoothing parameter is equal to
𝛼 =
2
12+1
= 0,15
.

We will calculate in two options to develop
forecast data for 2022-2026.
In the first option, the forecast amount is
calculated as follows:
y_(n+1)=y_n*0,15+(1-0,15)*y_(n-1) (14)
In the second option, the amount of the forecast is
calculated as follows:
𝑦
𝑛+1
=
𝑦
𝑛
+𝑦
𝑛−1
2
∗ 0,15 + (1 − 0,15) ∗
𝑦
𝑛−1
+𝑦
𝑛−2
2
(18)
In our study, a forecast for the next nine years was
made, (see table 2)
Table 2
Forecast of higher education services of the
country based on exponential texting, billion
soums
year
s
higher
educa
tion
servic
es,
billio
n
soums
, Y
Forecast amount
based on absolute
amount of current
and past periods,
option 1
Forecast amount
based on average
amount of current
and past periods,
option 2
𝑌
𝑝𝑟
Average
relative
error,
𝜀, %
𝑌
𝑝𝑟
Average
relative
error,
𝜀, %
2010
1412.
9
2011
1682.
1
2012
2070
2013
2459.
7
1740.
3
29.2
1596.8
35.1
2014
2917.
3
2128.
5
27.0
1934.4
33.7
2015
3435.
4
2528.
3
26.4
2328.4
32.2
2016
4034.
9
2995.
0
25.8
2761.7
31.6
2017
6057.
8
3525.
3
41.8
3260.2
46.2
2018
8292.
6
4338.
3
47.7
3931.8
52.6
2019
10616
.6
6393.
0
39.8
5365.7
49.5
2020
12043
.9
8641.
2
28.3
7517.1
37.6
2021
16020
.1
10830
.7
32.4
9735.9
39.2
2022
12640
.3
11735.5
2023
15513
.1
14008.9
2024
13071
.3
13727.0
2025
15146
.9
13021.6
2026
13382
.6
13793.9
2027
14882
.2
13379.3
2028
13607
,5 _
13434.5
2029
14691
.0
13559.6
2030
13770
.1
13420.4
Medi
um _
_
5920.3
8062, 5
33.2
7479.9
39.7
Due to the presence of "convex" amounts in the
time series in option 1, the amounts of the next period
of the forecasted time series are the same, and due to
the sliding time series in option 2, the amounts in the
last forecast time series are the same.
Based on the above information, we have the
following regression equations for forecasting
economic processes with stable inertial dynamics:
By volume of higher education services:
𝑌
𝑥
̂ = 308,35 ∙ 𝑡
2
− 3018,3 ∙ 𝑡 + 8184,7
Based on the developed regression equation, the
quality, content and accuracy of the model were
analyzed.
When the coefficients of determination are
calculated based on the formula (6), R^2=0,89 the
value means that the time dependence is very strong
and the time model is reasonable.
Using the formula (7), Fisher's F-criterion was
calculated based on the data in Table 1. According to
him, F=386.9 it was equal to A Fisher's F-test greater
than 4.75 indicates that the model is statistically
significant.
The average relative error of the approximation of
the model accuracy is found by the formula (10)
A=1/12*64.5=5.38 and is less than 10 percent, which
indicates high model accuracy.
When analyzed by Darbin-Watson criterion (d) by
formula (11), the number of observations is
d_real=1.41equal to 12, the factor is 1, and taking into
account the Jalwal data, it d_low=0.97can
d_high=1.33be said that there is no autocorrelation in
the time series value.
From the basic forecast indicators of higher
education services, we can see that the volume of
employees in higher education will increase by 106.9
percent in 2030 compared to 2021 (see Table 3).
Table 3
Dynamics of change of basic forecast indicators
of higher education services
Y
ea
rs
G
D
P
, bi
ll
ion
s
o
u
m
Absolute
increase
(decrease) in
s /
The rate of
increase
(decrease) is in
%
The rate of
additional
growth
(decrease) is
in %
Signific
ance of

Ba
si
c
m
et
hod
(
Y
1
-
Y
0
)
T
he
c
ha
in
is
a
s
im
il
ar
m
et
hod
(
Y
i
-
Y
i
-1
)
Basi
c
meth
od
100
0
1
Y
Y
The
chain
is a
simil
ar
meth
od
100
1
−
i
i
Y
Y
Ba
si
c m
et
hod
P
b
-100%
T
he
c
ha
in
is
a
s
im
il
ar
m
et
hod
P
Z
-100%
100
баз
А
1%
addition
al
growth
1
2
3
4
5
6
7
(5-
100
%)
8
(6-
100
%)
100
2
20
21
1602
0
-
-
-
-
-
-
-
20
22
1066
3.6
-
535
6.4
-
535
6.4
66.6
66.6
-
33.4
-
33.4
160.2
20
23
1147
4.1
-
454
5.9
810.
5
71.6
107.6
-
28.4
7.6
106,636
20
24
1228
3.8
-
373
6.2
809.
7
76.7
107.1
-
23.3
7.1
114,741
20
25
1309
2.9
-
292
7.1
809.
1
81.7
106.6
-
18.3
6.6
122,838
20
26
1390
1.4
-
211
8.6
808.
5
86.8
106.2
-
13.2
6.2
130,929
20
27
1470
9.4
-
131
0.6
808
91.8
105.8
-8.2
5.8
139,014
20
28
1551
6.8
-
503.
2
807.
4
96.9
105.5
-3.1
5.5
147,094
20
29
1632
3.8
303.
8
807
101.
9
105.2
1.9
5.2
155,168
20
30
1713
0.3
111
0.3
806.
5
106.
9
104.9
6.9
4.9
163,238
In our study, when determining the forecast of the
volume of higher education services in the
mobilization option, the amount allocated for higher
education from the state budget, income from
payment-contracts, and the amount of funds
appropriated at the expense of republican grants and
economic contracts are taken into account. we
analyzed the effect of the effect on educational
services in the form of a rank function. In this case,
the general regression equation took the following
form:
Values of regression equation parameters
𝐿𝑛𝑌
𝑌𝑇𝑋
= 5,92 + 0,41𝐿𝑛𝑋
𝑠𝑡𝑎𝑡𝑒 𝑓𝑢𝑛𝑑
+ 0.52𝑋
𝑝𝑒𝑟𝑠.𝑓𝑢𝑛𝑑
+ 0.11𝑋
𝑠𝑐ℎ𝑜𝑙𝑎𝑟𝑠ℎ𝑖𝑝𝑠
It can be seen that, according to the data of the
regression equation, if other factors remain
unchanged, increasing the amount allocated from the
state budget by one percent will increase the volume
of gross higher education services by an average of
0.41 percent, coming from the payment-contract
account. an increase in the amount of income by one
percent increases the volume of gross higher
education services by 0.52 percent on average, and a
1
Gretl based on statistics author development in the program
one percent increase in the amount of funds allocated
to foreign grants and economic contracts at the
Republic level increases the volume of gross higher
education services leads to an average increase of
0.11 percent.
It can be seen that the amount allocated from the
state budget to the volume of gross higher education
services and the income from the payment contract
have a significant impact on the increase in the
volume of services in the field of gross education.
We determined the forecast values for the volume
of higher education services until 2030 according to
the developed model.
3 . GDP of the country, volume of total services and volume of
higher education services forecasted in 2022-2030
From the graph in Figure 2, it can be seen that the
growth of higher education services is faster than the
country's GDP. This, in turn, is explained by the fact
that the price and quality of higher education services
are in line with the wishes of consumers in the
increase in the demand for educational services.
In our study, basic, inertial and mobilization
forecasts of the volume of higher education services
until 2022-2030 were developed.
Table 4
Forecast indicators of higher education services,
billion soums
Years
Basic
Inertia Mobilization
2022
10663.6
13942.0 18776.1
2023i
11474.1
15176.1 24729.3
2024
12283.8
16410.2 27277.3
2025
13092.9
17644.3 34542.2
2026
13901.4
18878.4 44662.9
2027
14709.4
20112.5 53824.7
2028
15516.8
21346.6 65321.9
2029
16323.8
22580.7 72407.3
2030
17130.3
23814.8 82994.0

Figure 4. Forecast indicators of basic, inertial and
mobilization options of the volume of higher education
services in 2022-2030
Table 5
The forecast value of higher education services is
the share of the country's GDP and total services
The
ye
ar
_
The
si
ze
o
f t
he
c
ount
ry'
s GD
P
,
bi
ll
io
n
soum
s
Of this, the
share of
higher
education
services , %
Total
services
, billion
soums
Of this, the
share of
higher
education
services , %
B
asi
c
Ine
rti
a
Mobi
li
za
ti
on
B
asi
c
Ine
rti
a
Mobi
li
za
ti
on
20
22
7823
35.9
1.
4
1.
8
2.
4
304328.
7
3.
5
4
.
6
6.
2
20
23
8831
87.7
1.
3
1.
7
2.
8
347092.
8
3.
3
4
.
4
7.
1
20
24
9405
94.9
1.
3
1.
7
2.
9
377178.
6
3.
3
4
.
4
7.
2
20
25
1046
733.6
1.
3
1.
7
3.
3
427067.
3
3.
1
4
.
1
8.
1
20
26
1175
340.3
1.
2
1.
6
3.
8
481889.
5
2.
9
3
.
9
9.
3
20
27
1251
737.4
1.
2
1.
6
4.
3
520722.
8
2.
8
3
.
9
10
.3
20
28
1333
100.3
1.
2
1.
6
4.
9
561235.
2
2.
8
3
.
8
11
.6
20
29
1419
751.8
1.
1
1.
6
5.
1
607653.
8
2.
7
3
.
7
11
.9
20
30
1482
035.6
1.
2
1.
6
5.
6
650613.
6
2.
6
3
.
7
12
.8
By ensuring stable high growth rates in economic
sectors, in the next five years, the gross domestic
product per capita will be increased by -1.6 times
(from $1,750 to $2,800), and by 2030, the per capita
income will increase from 4,000 US dollars, and
"countries with higher than average income"
"creating the ground for entering the line is indicated
in the Decree of the President of the Republic of
Uzbekistan dated January 28, 2022 No. PF-60 "On
the Development Strategy of New Uzbekistan for
2022-2026". As a result, it was determined that the
share of higher education services in GDP will reach
5.6% and the share of total services in GDP will reach
43.9% according to the optimal option, that is, the
mobilization forecast indicator.
CONCLUSIONS
The number of republican higher education
institutions was 65 in 2010, and by 2021 it has
doubled to well over154.
The increase in the number of higher education
institutions operating in the republic has increased
year by year, the leader in the ranking of the
number of higher education institutions is the city
of Tashkent. In 2021, there are 51 higher education
institutions in it, which is 40.2% , in the
Samarkand region - 12 (9.4%), in the Fergana
region - 10 (7.9%), in the Republic of
Karakalpakstan - 9 (7.1%), in the Syrdarya and
Navoi regions - 2 It is 1.6% of the total number of
higher education institutions.
Between 2010 and 2021, the country's GDP
increased by 9.3 times, total services by 8.3 times,
and higher education services by 11.3 times. Over
the past 12 years, higher education services have
grown more than other types of services as part of
total services.
According to the determined regression
equation, if other factors remain unchanged, an
increase in the amount allocated from the state
budget by one percent increases the volume of
gross higher education services by 0.41 percent on
average, and the volume of revenue from payment-
contracts by one percent. an increase in the volume
of gross higher education services by 0.52% on
average and an increase in the volume of funds
allocated to foreign grants and economic contracts
at the Republic level by one percent, the volume of
gross higher education services by 0.11% on
average leads to a percentage increase.
The volume of higher education services in the
republic was analyzed using the exponential
leveling method of the absolute amount and the
average amount of the current and past periods,
and the indicators of the future period were
forecasted using the regression equation for
forecasting economic processes with stable inertial

dynamics. The forecast value in the inertial option
showed that 2030 will increase by 148.7 percent
compared to 2021. Based on the forecast indicators
of higher education services, the dynamics of
change will lead to a 106.9 percent increase in the
number of employees in higher education in 2030
compared to 2021. According to the forecast
indicator in the mobilization option, the volume of
higher education services will reach 518.1 percent
in 2030 compared to 2021.
As a result, it was determined that the share of
higher education services in GDP will reach 5.6%
and the share of total services in GDP will reach
43.9% according to the optimal option, that is, the
mobilization forecast indicator.
The fact that the growth of higher education
services is faster than the country's GDP is
explained by the fact that the price and quality of
higher education services are in line with the
consumer's desires in increasing the demand for
educational services..
REFERENCES
[1]
Decree No. PF 5847 of the President of the Republic
of Uzbekistan dated October 8, 2019 "On approval of
the concept of development of the higher education
system of the Republic of Uzbekistan until 2030"
[2]
Address of the President of the Republic of Uzbekistan
Sh.M. Mirziyoyev to the Oliy Majlis. “Halq so’zi”
newspaper. December 29, 2020.
[3]
National Systems of Innovation: Towards a Theory of
Innovation and Interactive Learning. B.-A. Lundvall.
– 1992. – P. 2
[4]
Miles R.E. Network organization: New concepts for
the new forms / R.E.Miles, C.C.Snow // California
Management Review. –1986. –Vol. 28, № 2. –P. 62-
73.
[5]
Парфенова С.Л. Сетевая модель организации
научной деятельности // Наука. Инновации.
Образование. –2014. –№ 16. –С. 78 –89.
[6]
Mamatov, Akhmetjon Atajanovich, Berdiyev, Gayrat
Ibragimovich, Mamatov, Mamajan Ahmadjonovich.
The level of economic security of kashkadarya region
and the methodology of its assessment. ACM
International Conference Proceeding SeriesСтраницы
477 – 483 15 December 2022 6th International
Conference on Future Networks and Distributed
Systems, ICFNDS 2022 Tashkent.
[7]
Mamatov,
Akhmetjon
Atajanovich,
Mamatov,
Mamajan Ahmadjonovich. Econometric forecasts of
the impact of high and medium-tech industries on
economic growth in Uzbekistan. ACM International
Conference Proceeding Series Страницы 468 – 476
15 December 2022 6th International Conference on
Future Networks and Distributed Systems, ICFNDS
2022 Tashkent.
[8]
A. Sultanov, Jumaniyazov, K. Halmuratov, example
of a state-especially a prosperous state based on a
corporate culture of partnership. "Economic and
technological news" electronic science magazine. 3rd
Vol, 2017. May-June.
[9]
Mirziyoyev GM Shavkat Mirziyoyev, President of the
Republic of Uzbekistan, appeal to the Oliy Majlis. T. /
/ “Halq so’zi” newspaper, 2022 Yale University
December 21.
[10]
Resource from the Ministry of Higher and Secondary
Special Education of the Republic of Uzbekistan.
[11]
Allen L.Webster. Applied Statistics for Business and
Economics. USA, Bredley University. 1995. p – 1047.
[12]
A.A. Mamatov, A.F. Khurramov, M.A. Mamatov,
A.D. Anarkulov, and S. Kh. Khasanov. 2021. Integral
improvement of economic safety of the regions. In The
5th International Conference on Future Networks &
Distributed Systems (ICFNDS 2021), December 15,
16, 2021, Dubai, United Arab Emirates. ACM, New
York,
NY,
USA,
5
pages.
https://doi.org/10.1145/3508072.3508214.


