

Vol. 34 (2023):
Miasto Przyszłości +62 811 2928008 .
180
Miasto Przyszłości
Kielce 2023
Impact Factor: 9.2
ISSN-L: 2544-980X
Factors Affecting the Level of Population
Urinboyeva Yulduz Pirnazarovna
1
, Tashniyozova Sevara Qilichboy kizi
2
The formation of a socially oriented market economy and the increase in the standard of living of the
population on this basis is established as an important direction and main goal of socio-economic
reform.
At the present stage of the development of human society, the sphere of services is directly and
inextricably linked with human life, its standard and quality of life, its existence in favorable
conditions. Today, the field of services has occupied such a strong position in the social economic
development of society that it is impossible to imagine the use of labor resources without this sphere,
ensuring employment of the population, increasing its income, promoting living well-being, achieving
economic growth, forming a modern informed society, saving human capital, bringing the perfect
generation to adulthood and other important aspects
At the present stage of the development of society, the daily economic activity of a person, the
livelihood of living a meaningful life in favorable conditions, the possession of literate, enlightened,
high culture and spirituality are associated with the service sector.
It is based on the share of the service sector in the gross domestic product, the per capita distribution of
these services that it is possible to draw conclusions about the standard of living of the country's
population, determine the category of the country, its level of Economic Development (developed,
developing, stable), at what stage of development (industrial, post-industrial).
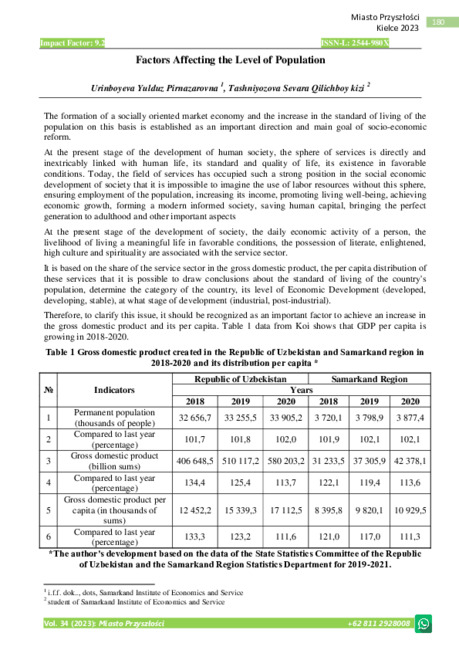
Therefore, to clarify this issue, it should be recognized as an important factor to achieve an increase in
the gross domestic product and its per capita. Table 1 data from Koi shows that GDP per capita is
growing in 2018-2020.
Table 1 Gross domestic product created in the Republic of Uzbekistan and Samarkand region in
2018-2020 and its distribution per capita *
№
Indicators
Republic of Uzbekistan
Samarkand Region
Years
2018
2019
2020
2018
2019
2020
1
Permanent population
(thousands of people)
32 656,7
33 255,5
33 905,2
3 720,1
3 798,9
3 877,4
2
Compared to last year
(percentage)
101,7
101,8
102,0
101,9
102,1
102,1
3
Gross domestic product
(billion sums)
406 648,5 510 117,2 580 203,2 31 233,5 37 305,9 42 378,1
4
Compared to last year
(percentage)
134,4
125,4
113,7
122,1
119,4
113,6
5
Gross domestic product per
capita (in thousands of
sums)
12 452,2
15 339,3
17 112,5
8 395,8
9 820,1
10 929,5
6
Compared to last year
(percentage)
133,3
123,2
111,6
121,0
117,0
111,3
*The author's development based on the data of the State Statistics Committee of the Republic
of Uzbekistan and the Samarkand Region Statistics Department for 2019-2021.
1
i.f.f. dok.., dots, Samarkand Institute of Economics and Service
2
student of Samarkand Institute of Economics and Service

Vol. 34 (2023):
Miasto Przyszłości +62 811 2928008 .
181
Miasto Przyszłości
Kielce 2023
Most notably, the growth rate of GDP in the Republic and the province between 2018 and 2020 has
been significantly higher compared to the growth rate of the permanent population. The number of
permanent residents compared to the previous year increased by 1.7% in the Republic in 2018, and by
1.9% in the province. The growth of GDP per capita is a sign that there is an opportunity to increase
the Real income of the population and, therefore, to raise its standard of living and quality. The
increase in the per capita growth rate of GDP, in addition to meeting the growing needs of all segments
of the population, also increases the availability of services. But this growth cannot be the basis for
concluding that all segments of the population are fully using material goods, especially services. As a
result of material stratification, underprivileged segments of the population have the opportunity to
consume services cheaply and, alternatively, in a very limited volume.
One of the important factors that ensure the well – being of the population is the employment of the
population. "The problem of employment is the product of an economy based on market relations,
which arises as an integral part of it and, due to its extreme importance, always stands in the spotlight
of heads of state, economic scientists, the public. Without solving this serious problem, it is logically
wrong to talk or think about a market economy oriented towards the social sphere, the material
prosperous life of people, the high quality of life, and politically it is a bitch" [1].
This is due to the fact that serious attention is paid to the issues of employment in Uzbekistan, which
are socially oriented and consistently shape the market economy, aimed at ensuring the well-being of
large segments of the population. Employment is a priority of socio-economic policies implemented in
the country.
President of the Republic of Uzbekistan Sh.M.Mirziyoev expressed the opinion: "the employment of
the population is not only economic, but also of great social importance to us. In addition to
municipalities, ministries and departments, employer organizations, banking institutions should be
more actively involved in this work. We should also take great opportunities for the development of
tourism in the settlement of employment " [2]. We think that the service sector should play a leading
role in the performance of these important tasks. We conducted a comparative analysis of the
indicators of the Republic of Uzbekistan with the Samarkand region in order to identify the existing
opportunities in solving employment problems of the service sector and make the most of them.
An analysis of the state of employment in the sectors of the economy of the region for the period 2018-
2020 gave the following results. Studies indicate that the province's permanent population has
increased year by year over the next 2018-2020 period. Especially in the economy, the number of busy
residents has increased rapidly. As a result, the proportion of the population in this category in the
permanent population was 37.6% in 2010, while as of 2018 it was almost 40.6%. This is the result of
serious changes taking place in the economy of the province. There is a significant increase in the
share of the economically active population in the number of labor resources in the region. If in 2010
the economically active population in the economy of the region was 1324.6 thousand people, by 2018
the number was 1575.7 thousand people, or increased by 18.9 percent (251.1 thousand people) during
the same period. During the period 2010-2018, there were major changes in the employment of the
population of the region by sector. In general, the creation of less new jobs in the sectors of material
production (industry, agriculture, construction) compared to the service sector is achieved.
In the sectors of the economy, the highest rate of employment of the population falls on the service
sector. In 2010, 654.4 thousand people, as of 2018, this figure was 770.8 thousand people. Such
changes in the structure of population employment can be assessed as a positive process. Because it
corresponds to the essence of the macroeconomic policy that is being pursued towards increasing the
role of the service sector in the socio-economic development in the country.
In order to assess the opportunities and prospects for increasing employment of the population in the
Samarkand region by industry and networks, it is important to compare it with the indicators of the
Republic, to find answers to social issues (Table 2).

Vol. 34 (2023):
Miasto Przyszłości +62 811 2928008 .
182
Miasto Przyszłości
Kielce 2023
Table 2 Growth rates of population employment in 2017-2020 by economic sectors of the
Republic of Uzbekistan and Samarkand region *
Indicators
The Republic of Uzbekistan
Samarkand Region
Years
2017
2020
2017
compared to
2020
(percent; +:-)
2017
2020
2017
compared to
2020 (percent
+:-)
1
Permanent population
(thousands of people)
32120,5 33905,2
5,6
3651,7 3877,4
6,1
2
Labor resources
(thousands of people)
18666,3 19142,33
2,6
2079,6 2130,4
2,4
3
Percent of permanent
population
58,1
56,5
-2,8 point
56,9
54,9
-3,5 point
4
Economically active
population
(thousands of people)
14357,3 14797,9
3,1
1629,8 1585,4
-2,7
5
In relation to labor
resources (in percent)
76,92
77,30
+ 0,5 point
78,4
74,4
-5,0 point
6
Population employed
in the economy
(thousands of people)
13520,3
13239,6
-2,1
1523,1 1410,9
-7,3
including:
7
Employment in
industry (thousands)
1826,8
1789,7
-2,0
204,1
191,5
-6,2
8
Employed in the
economy in relation
to the population
(percentage)
13,5
13,5
0
12,9
13,6
5,4
9
In agriculture
(thousand people)
3671,3
3560,0
-3,0
406,8
392,2
-3,6
10
Employed in the
economy in relation
to the population
(percentage)
27,2
26,9
- 0,9 point
26,0
27,8
6,8 point
11
In the field of
construction
(thousands of people)
1290,0
1267,8
-1,7
151,8
138,3
-8,9
12
Employed in the
economy in relation
to the population
(percentage)
9,5
9,6
+ 0,3 point
9,7
9,8
+1 point
13
In the field of
services (thousands
of people)
6732,2
6622,0
-1,6
760,4
688,9
-9,4
14
Employed in the
economy in relation
to the population
(percentage)
49,8
50,0
+ 0,4 point
47,5
48,8
+ 2,9 point
*Author's development on the basis of data from 2017-2020 of the State Statistical Committee of
the Republic of Uzbekistan and the statistical department of the Samarkand region.

Vol. 34 (2023):
Miasto Przyszłości +62 811 2928008 .
183
Miasto Przyszłości
Kielce 2023
As a result of comparison, the share of the employed population in the economy in the service sector in
the Samarkand region was 47.5% in 2017, while in the Republic this figure showed a relative
difference of 49.8%, and in 2020 (48.8-50.0%, respectively). As we noted above, as the material and
technical base of material production networks is strengthened and labor productivity increases in it,
the number of busy populations in this network will continue to decrease further. From the results of
the analysis, it can be concluded that they will be able to get a job in service sector networks, which
are mainly developing rapidly and many new jobs are being created.
The transition of the Republic of Uzbekistan to development in the direction of innovation requires the
widespread use of the achievements of Science in all sectors of the national economy. The provision of
educational services to the population ensures an increase in the educational level of the population
and the formation of an innovative economy in the country and, through it, a comfortable standard of
living of the entire population. That is why, by providing educational service to the population, it will
be possible to study the issues of increasing their education and find the right solution to the problems
that await their solution in this regard.
Labor in the field of services is distinguished by originality, even from the point of view of ingenuity.
That is, those with higher education in this area can also find jobs without higher education (skilled
servants). Holding positions in a multi-service profession requires education. That is, examples of
teachers, health doctors, art-oriented cultural workers, etc. That being said, the proportion of
employees with higher and secondary special education in the service sector sectors is higher
compared to the production sectors (Table 3).
The composition of the population employed in the sectors of the economy in the Republic of
Uzbekistan and Samarkand region in 2010-2020 (in percent)*
№ Indicators
Years
2010
2020
Total busy
population
higher
education
secondary
special
education
secondary
special
education
and
incomplete
secondary
special
education
higher
education
secondary
special
education
secondary
special
education
and
incomplete
secondary
special
education
Republic of Uzbekistan
1.
In the total
economy
100
31,5
37,5
31,0
35,3
43,7
22,8
2. In industry
100
16,9
44,7
38,4
17,1
43,8
39,1
3. Agriculture
100
16,8
46,2
37,0
17,1
47,3
35,6
4. Building
100
17,1
35,4
47,5
18,5
36,0
45,5
5. Service
100
33,6
39,3
27,1
35,9
41,9
22,2
Samarkand Region
1.
In the total
economy
100
30,9
38,2
30,9
36,7
42,4
20,9
2. In industry
100
17,1
43,3
39,6
17,4
44,1
38,5
3. Agriculture
100
15,9
48,2
35,9
16,3
46,4
37,3
4. Building
100
18,1
36,1
45,8
19,2
37,1
43,7
5. Service
100
34,2
32,1
33,7
37,3
36,1
26,6
*Author's development on the basis of data from 2011-2021 of the State Statistical Committee of
the Republic of Uzbekistan and the statistical department of Samarkand region.
The achievement of these strategic goals is to put on the agenda as the most important task to increase
the level of employment quality, taking into account modern theories of the labor market. Because, in

Vol. 34 (2023):
Miasto Przyszłości +62 811 2928008 .
184
Miasto Przyszłości
Kielce 2023
the current period, the main subject of the labor market is not ordinary labor, but an employee who
performs the function of generating profit in the economy through scientific and technical progress
through intelligence (intelligence - intelligence, perception, intelligence; mental maturity, human
thinking potential) and consciousness (consciousness – logical and creative thinking, the highest level
of human mental activity). [3]
Experts believe that ensuring effective socio-economic development requires that 40.0-60.0% of the
population of the country in adulthood have higher education, 2.0-5.0% of them are scientific
employees. This requires educational services to be upgraded to a new level of quality. This can also
be seen through the experience of developed countries. For example, in the countries of the European
Union, there are 5.36 scientists at the expense of every 1000 employees. This figure is even higher in
the US (8,66) and Japan (9,72) [4]. So in these countries, the innovation education service is also very
high.
Literacy rate of population in Uzbekistan is among the highest in the world at 99.3%. The number of
higher education institutions in the country is 60, the OSCE branches are 11, the branches of higher
education institutions of foreign countries are 7, and more than 260,000 students receive education in
more than 850 areas and specialties required by Life Itself[5].
According to the philosophy of human life and living, he satisfies his endless needs primarily through
his occupation, his craft in his hands. Through the satisfaction of the material and spiritual needs of
each individual, the fulfillment of his desires, the promotion of his interests to the level of national
interest, the development of the sphere that he occupies in his specialty, networks on this basis, is
achieved. This, in turn, determines the prospect of future development of the areas occupied in
secondary specialized vocational educational institutions, higher educational institutions, depending on
the employment of the population by Network Groups [6].
Another factor affecting the standard of living of the population is financial security. At this point, we
studied investments in fixed capital by sectors of the economy. In the Republic, 36.5% of investments
in fixed capital in 2017 were spent on material production, while 63.5% were directed to the
development of the service sector. The share of investments in fixed capital in material production
increased in 2017-2020 (to 8.1 points, respectively).
Our analysis of service sector networks has yielded the following results. The most focused investment
in the Republic in 2017 coincided with transportation and storage, residential construction services. In
2017-2020, there was a significant increase in the share of investments in the residential construction
service. The share of investments in transportation and storage services has significantly reduced.
Khattaki said that a greater share of foreign investments fell on the industrial sector of material
production (22.4 percent in 2017, 58.5 percent in 2020, respectively). In 2017, 74.2 percent of foreign
investments fell on service sectors, while the highest share was directed to transportation and storage
service (46.0 percent), Information and communication service (22.3 percent). In 2020, 13.1 percent
went to the transportation and storage service, and 7.2 percent[7] to the information and
communication service.
Therefore, in order to solve this problem that has arisen, it is important to determine in which areas of
education investment flows can be involved.
Currently, the return on investments in which intellectual capital is attracted is required for 10-15
years. This is due to the fact that the attraction of investment in education is due to the penetration of
new innovative tools into the educational sphere. But the attraction of investments to work with them
remains low. As a result, until the skill in relation to new equipment becomes characteristic (for 5-10
years), there is an obsolescence of equipment introduced in the form of investment in education.
As can be seen from the above comments, the economic reforms in our country, in which the growing
strengthening of the banking and financial sphere is carried out, are laying the groundwork for
increased financial security, comprehensive support of the real sector of the economy, as well as the
provision of stable economic growth rates. Already, the economic relations that occur for the

Vol. 34 (2023):
Miasto Przyszłości +62 811 2928008 .
185
Miasto Przyszłości
Kielce 2023
continuous continuation of the activities of the subjects of the service sector are carried out directly
through financial resources.
Among the factors affecting the standard of living of the population, an important place is occupied by
the block of general economic indicators, which includes income, consumption and expenses. The
income of the population at their disposal (money and total income) has a close right correlation with
the standard of living in proportion to consumer prices. The income of the population is formed under
the influence of certain conditions. That is, the increase in gross domestic product per capita leads to
an increase in the Real income of the population. Today, about half (49.5 percent) of the gross
domestic product created in the country falls into the service sector. The increase in the income of the
population has a positive effect on the volume of services consumption. Increasing the demand for
services leads to an increase in employment in the service sector and, through it, to an increase in the
income of employees employed in it. As a result of the introduction of technologies and technologies
in the field of material production, the opportunity to use the resources of labor that have been
dismissed (in the economic sectors of the Samarkand region in 2020, the total number of items is
1485.1 thousand people, of which 714.3 thousand people are employed in the field of material
production, 770.8
One of the reasons for the rapid development of the service sector is an increase in the free time of the
population and an improvement in working conditions (reduction in the working day, reduction in the
period of retirement, increase in vacation days). With an increase in the free time of the population, its
need for services increases.
The above-mentioned conditions are reflected in the formation of the income of employees employed
in the service sector and ensure its peculiarities.
They determine the daily consumption opportunities of the population, while the consumption of
goods and services by the population is one of the most important components of the standard of
living. The different social strata of the population are based on the improved, detailed analysis of the
standard of living in the country based on the use of statistics on the distribution of income, as well as
on welfare and consumption, since the separation of society into social strata occurs due to the uneven
distribution of wealth. The current stage of economic development of society is directly connected
with the increase in the standard of living of the population. The development of any area of activity,
whether it be industry, agriculture or the service sector, ultimately serves to increase the standard of
living, directly or indirectly.
The standard of living of the population in each country depends on the nature of the system of society
(state), the robustness of the Institute of law and the observance of human rights, the ratio of different
branches of power, its interaction with other regions (enterprises).
List of literature used
1.
Mukhammedov M.M., Urunbaeva Yu.P. etc.
Theoretical foundations of the service sector and the development of and tourism: Samarkand,
2017.-127 b., U.X.Khudayberdiev population standard of living. Samarkand, 2021. – 150.
2.
Scientific and methodological brochure on the study of the state program on the implementation of
the strategy of action on the five priority areas of development of the Republic of Uzbekistan in the
"year of dialogue with the people and human interests"in 2017-2021. - Tashkent: Spirituality,
2017.- 166 P.
3.
Nusratullin V.K.Neravnovesnaya economika. 2-e izd., dop. - M., 2016. S. - 261.
4.
Gamington W.J. How big is the Brown Diane? INF. Working Paper 98/02, Washigton, 2015.
5.
Jamolidinova O., Aminov F. Young people with modern knowledge and high intellectual potential
– a guarantee of our great future // "enlightenment", November 26, 2016.

Vol. 34 (2023):
Miasto Przyszłości +62 811 2928008 .
186
Miasto Przyszłości
Kielce 2023
6.
4.5 On the strategy of action for the further development of the Republic of Uzbekistan. improving
state policy on youth. The organization of the following complex measures aimed at raising a
highly educated and intellectually developed generation, raising their spirituality and culture: "we
are the backbone of the motherland", "our greatest support and backbone, our decisive force is
youth", shares under the slogans (in 2017).
7.
Annual statistical collection 2018-2021. 245 b.


